
Through empirical research, SHARE Foundation created a map of the Internet in Serbia and analysed the implications network structure could have on Internet filtering. By visualising and analysing the structure and topology of individual Internet Service Providers in Serbia, we tried to determine how easy it would be to install filtering devices on these networks. This data was used to inform the government on the proposal of a new law. In addition, the output of this research can be used for different qualitative measurements of the network, such as bandwidth, IPv6 penetration and Internet throttling.
Introduction
Internet cartography is a recent hot topic in the IT world. The Internet is an abstract space that provides limitless opportunities, but it consists of hardware, millions of servers, routers, cables and other network peripheral devices. In most cases, there is a physical cable or wireless connection reaching almost every corner of the world and every Internet user. Each and every network device of the Internet infrastructure has its own physical location. Some of them are grouped, which makes their locations a sort of “crossroads” of the Internet.
Packets travel through thousands of kilometres of cables, myriads of routers and switches, different national territories and a number of potential spots where they can be retained, slowed down, stored, copied or examined.
What is the structure of the Internet?
Our first step in understanding this invisible network was to try to understand the structure of our nearest networks, run and owned by our Internet Service Providers (ISPs). Every ISP is a story in itself: they have different legal regimes, business and technical relationships, privacy policies and ownership models, different numbers of users, and a different number of interconnected routers organised in different structures.
Research methodology
The range of IP addresses allocated to one ISP was the starting point of our research. The research process is divided into four phases. Every phase is equally important since it provides the input data for the phase that follows. The final output of this research can also be used as an input to some other, more advanced analysis.
1. Determining the IP ranges
First we looked at the RIPE Database and took all the IP ranges registered to organisations in Serbia. Below you can see a representation of ISPs in Serbia and the number of IP addresses alocated to them.

Figure 1: Diagram representing the number of IP addresses per ISP in Serbia.
2. Scanning the network
There is a simple tool, called traceroute, which is mostly used in network diagnostics. This tool shows the hops a packet takes when travelling over the Internet by sending ICMP messages and waiting for responses from the destination hosts.
To traceroute ranges of IP addresses there is a special tool called Nmap (Network Mapper), which is quite user-friendly, detailed and precise. Naturally, the bigger the range, the more computer resources are exploited. Basically, Nmap traceroutes the paths between the hosts on which it runs and every IP address from the range that is being scanned.
Note: The output actually consists of the routes that connect the source computer to all the active hosts from the range that accept ICMP messages.
3. Data processing
The output of these scans is what we can call “raw data” in this case. From this raw data set we removed all those hosts that didn't give a response during the scans. We then stored the remaining data as a .csv file with three fields: Source IP, Destination IP and Label. This was used as input for the visualisation software.
The output of Nmap can be stored as an .xml file. In essence, what is needed is a piece of software that will extract some text from one file and put it in another. There is an ample variety of solutions available online, mainly in the form of scripts. In this case we used a Python script available on GitHub.
The script takes two arguments, the input file and the output file, and searches the text files for certain words (in this case trace and ipaddr ). When it gets to those predefined keywords, it records their values. In the end it generates a . csv file with the required structure (in this case omitting the Label field, which is not required).
4. Data visualisation
In order to visualise large sets of data, in this case more than 300,000 different IP addresses and the links between them, we needed to find a tool that has the ability to display, manipulate and transform the network into a map. We used Gephi, an interactive visualisation and exploration platform for different kinds of networks and complex systems and for dynamic and hierarchical graphs. The obtained results are available online. On our website you will find maps of 18 ISPs in Serbia such as the one shown in Figure 2 below.

Figure 2: Map of ISP HallSys.
Our main challenge was how to represent a large number of nodes in a most convenient way and still have a visualisation that would be useful for further research. During our tests, most of the Graph Layout Algorithms integrated into the Gephi software failed to deal with large networks (100k+ nodes) except for the OpenOrd and ForceAtlas2 algorithms (at least partially).
ForceAtlas2 , the algorithm that we used in the end, is a Continuous Graph Layout Algorithm, a force-directed layout, which integrates different techniques such as the Barnes Hut simulation, degree-dependent repulsive force, and local and global adaptive temperatures.
In order to represent the results more clearly, we chose to eliminate end-nodes and eliminate “noise”. This reduced data set consisted of 4,067 nodes: IP addresses that represent the interconnected infrastructure of the main routers and servers serving the End Users in Serbia. You can see this map below in Figure 3. You can find a larger version of this map online.

Different structures and what we can learn from them
Network structure analysis can be useful for different aspects of network security and efficiency. However, in this case our main interests as researchers were related to possible privacy-related misuse of the network (digital surveillance and data retention) and different forms of Internet filtering, content control and censorship.
There are three basic network structures:
- Centralised: All devices are connected to one centre. This centre has privileged accessibility and thus represents the dominant element of the network.
- Decentralised: Although the centre is still the point of highest accessibility, the network is structured so that sub-centres also have significant levels of accessibility.
- Distributed: No centre has a level of accessibility that significantly differs from the others.
By analysing our visualisations of ISPs in Serbia we noted that both centralised and decentralised models are present. An example of a centralised network model can be seen in the network of the state-owned Telekom Serbia. An example of a decentralised model can be seen in the university network AMRES (see more on these two networks below).
But, except feeding our curiosity for deeper understanding of our technological environment and passion for visualising big sets of data, is there a practical use of those maps in the field of Internet freedom and user privacy?
The game of filtering
Internet filtering (or Internet censorship) is one of the most widespread forms of government control on the Internet. Internet freedom around the world has declined for the fourth consecutive year, with a growing number of countries introducing online censorship and monitoring practices that are simultaneously more aggressive and more sophisticated in targeting individual users (see more on this on the Freedom House website ).
There are three commonly-used techniques to block access to Internet sites: IP blocking, DNS tampering and URL blocking using a proxy. These techniques are used to block access to specific web pages, domains, or IP addresses. When the targeted websites are outside the legal jurisdiction of the government (i.e. in a foreign country) this is the most effective way to block access for their citizens. There are more advanced techniques (e.g. blocking searches involving blacklisted terms, keyword analysis and dynamic content analysis) but they are rather rare and are subject to further research.
Related to our ISP mapping efforts, the following question was most interesting to us: Where will Internet filtering take place on the ISP network topology? According to the OpenNet Initiative study , Internet filtration can occur at any or all of the following four nodes in a network:
- Individual computers.
- Institutions: Filtering the network on an institutional level using technical blocking.
- Internet Service Providers: Government-mandated filtering is most commonly implemented by ISPs using any one or a combination of the technical filtering techniques mentioned above.
- Internet Backbone: State-directed implementation of national content filtering schemes and blocking technologies may be carried out at the backbone level, affecting Internet access throughout an entire country. This is often carried out at the international gateway.
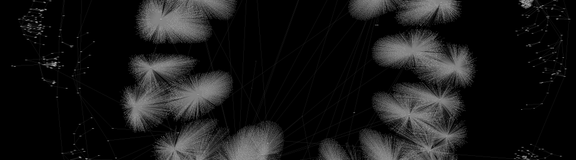
The AMRES case
In one of our previous research projects (in Serbian only) , we looked at Internet filtering at the national research and education network of Serbia AMRES. We discovered a decentralised method of content filtering, delegated and executed through local administrators and routers at every university in Serbia. Each local administrator is responsible for their own blacklist of sites and ports. AMRES is one of the oldest ISPs in Serbia, established in the early 1990s, and its method of Internet filtering presented here is filtering on an institutional level. If we take a look at the visualisation of the AMRES network (in Figure 4), we can clearly see why this method of Internet filtering was most applicable: the decentralised structure of the AMRES network somehow imposes this kind of filtering strategy.

Figure 4: Map of the AMRES network.
In our view, the structure, topology and complexity of a network, and also its ownership model and management needs, play a crucial role in defining the model of Internet filtering, along with the amount and type of equipment that will be used. For us, users or researchers without access to privileged information, the analysis of network topology maps can be a starting point for better understanding infrastructures of control and potential repression.
Proposal of a new law in Serbia
In December 2014, the Government of the Republic of Serbia sent a Proposal of the Law on Amendments to the Law on Games of Chance to the Parliament (in Serbian). The proposed changes were adopted without discussion and public insight, even though these provisions would introduce Internet censorship in Serbia through a “back door”. What presented the main problem was the amendment of Article 10 of the current law, i.e. the new Item 16 of Paragraph 1, which prohibits “enabling access to websites by domestic electronic communication network service operators to legal entities or individuals organizing games of chance without the approval or consent of the Administration”. What this basically means is that the government suggested filtering (or censoring) access to online gambling sites in order to regulate gambling. To be able to do that, ISPs would have to monitor which sites their users are visiting.
Fortunately, after the SHARE Foundation analysed the proposal and started a media campaign, the proposal of the law was withdrawn from the parliamentary procedure following an intervention of the government. In one part of the proposal, it was written that the installation, maintenance and costs of the equipment intended for filtering is the responsibility of the ISPs. In order to estimate the (unreasonable) costs ISPs would bear, we analysed the network topology maps of every individual ISP in Serbia to see how much and what kind of equipment they would need to purchase. Even though our method is not 100% accurate, we had something to work with, something that gave us an insight into the unknown and invisible design of the networks.
The Telekom Serbia case
By looking at the map of Telekom Serbia’s network (see Figure 5), the biggest ISP in Serbia and owner of the biggest share of the infrastructure, we could observe a highly centralised structure where almost all the main nodes and routers were connected to just two main servers.

Figure 5: Map of Telekom Serbia.
The logical conclusion is that in order to perform real-time filtering they would need to install equipment exactly in those two points. On the other hand, from the number of nodes attached to those two main routers, we can assume that they are able to process huge amounts of traffic, therefore the equipment they would need to install would probably need to be of high-end performance. We were able to predict the type and cost of the theoretical filtering solution, given that there are just a few manufacturers of such equipment.
Conclusion
We played the game of filtering based on the maps of the other ISPs as well, and each of them was a story in itself. Most of them were much more decentralised and we needed more efforts to find out where filtering could potentially happen. Decentralised networks are more complex to control, they have more crossroads, more points to cover if you want to have access to all the data flows. That said, it’s hard not to see the shape of the Panopticon structure in networks similar to the one of Telekom Serbia.
Given that our analysis is still only at the level of an individual ISP, this is just a small fragment of the story. The Internet is a network of networks, and to be able to create a full picture and to understand where the points of control are, we need to examine their local interconnections and links to the International networks. This is a topic for further research.
Read more about the latest SHARE Foundation research at labs.rs .

Comments 0
Comments are disabled on articles published more than a year ago. If you'd like to inform us of any issues, please reach out to us via the contact form here.