
In this article I describe how I am using the atlas_exporter to export metrics based on RIPE Atlas results to Prometheus.
Introduction and Goals
I'm a big fan of Prometheus and time-series-based monitoring in general. While attending RIPE 74, I came up with the idea to use RIPE Atlas measurement results to improve my blackbox monitoring. The main goal was to monitor trends regarding latency, packet loss and hop counts. For example this gives me the opportunity to see impacts of changes after doing some traffic engineering. It's also helpful to see how latency changes over time and detect loss to avoid performance issues.
Since there was not an out-of-the-box solution for exporting measurement results to Prometheus, I decided to implement an exporter for the RIPE Atlas API in Go. Fortunately the Go bindings for the API were already made available by DNS-OARC which saved a lot of time.
What is atlas_exporter?
The atlas_exporter retrieves measurement results from the RIPE Atlas API and maps them to metrics. Prometheus can scrape these metrics periodically from the HTTP endpoint provided by the application. Numeric elements in Atlas measurement results are mapped to metrics. Other key attributes become labels. As of today atlas_exporter supports almost all measurement types of RIPE Atlas. Only wifi is not supported yet, because there were no obvious choices for metrics. Currently only the last measurement result is retrieved. For future releases a time span based solution is already planned.
In my ASes I use Atlas metrics to monitor latency, packet loss and hop counts over time. An alerting based on these metrics is planned too. For example if a defined percentage of probes in a big eyeball AS can not reach my AS any more I want to be paged.
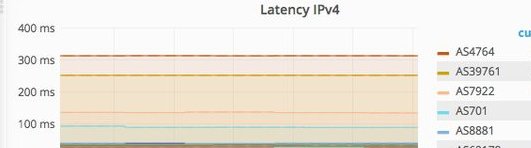
In the image below you can see a visualisation of ping and traceroute measurements in Grafana. In detail it shows the trend over one hour of latency and hop counts from 50 random probes targeting a router in one of my ASes. If there are more than one probe in the same AS the metrics of these probes are averaged.

Hopefully this project is useful for other people in our community too. Feedback will be much appreciated.
Below you can find the pointer to the source code for the atlas_exporter and some documentation on how to use the tool, including some example cases.
Source code and contribution
The source code for atlas_exporter is available on Github. I'm open for feature suggestions and pull requests. Please feel free to contribute.
AS-lookup and caching
Measurement data provided by the API does not contain AS information. For me it was important to get this information in a time efficient way. Based on the ID of the probe, atlas_exporter retrieves the AS number in a separate call per measurement result. These calls are performed in parallel. Of course it doesn't make sense to get this information during every scrape, so they are cached in memory for a defined time. There are two flags to configure the cache timers which can be set as start parameters.
| Parameter | Description | Default |
|---|---|---|
| --cache.ttl | Time before a probe lookup result expires and is removed from cache | 1 hour |
| --cache.cleanup | Interval for cleaning up expired cache lookup results | 5 minutes |
Filtering of invalid results
By default atlas_exporter ignores invalid measurement results. For example if the measurement shows IPv6 and a probe in the resultset is not compatible with IPv6, this probe is filtered out. This behavior can be changed by setting the filter.invalid-results flag to false when starting the program.
Running
From source code
Installation by go get requires Go Version 1.8:
go get -u github.com/czerwonk/atlas_exporter
After installation the atlas_exporter binary can be started from your GOPATH-bin directory
Using Docker
There is also a docker version available:
docker run -d -p 9400:9400 czerwonk/atlas_exporter
How to use the data
After starting atlas_exporter listens for connections on port 9400 by default. We can now scrape results from RIPE Atlas by using for example curl.
For measurement with id 8809582
curl http://[::1]:4200/metrics?measurement_id=8809582the result will look similar to this one:
# HELP atlas_ping_avg_latency Average latency
# TYPE atlas_ping_avg_latency gauge
atlas_ping_avg_latency{asn="3320",dst_addr="2001:678:1e0::1",dst_name="bb1.ix.dus.routing.rocks",ip_version="6",measurement="8809582",probe="29337"} 69.51094
# HELP atlas_ping_dup Number of duplicate icmp repsponses
# TYPE atlas_ping_dup gauge
atlas_ping_dup{asn="13030",dst_addr="2001:678:1e0::1",dst_name="bb1.ix.dus.routing.rocks",ip_version="6",measurement="8809582",probe="29568"} 0
atlas_ping_dup{asn="3320",dst_addr="2001:678:1e0::1",dst_name="bb1.ix.dus.routing.rocks",ip_version="6",measurement="8809582",probe="29337"} 0
# HELP atlas_ping_max_latency Maximum latency
# TYPE atlas_ping_max_latency gauge
atlas_ping_max_latency{asn="3320",dst_addr="2001:678:1e0::1",dst_name="bb1.ix.dus.routing.rocks",ip_version="6",measurement="8809582",probe="29337"} 128.10728
# HELP atlas_ping_min_latency Minimum latency
# TYPE atlas_ping_min_latency gauge
atlas_ping_min_latency{asn="3320",dst_addr="2001:678:1e0::1",dst_name="bb1.ix.dus.routing.rocks",ip_version="6",measurement="8809582",probe="29337"} 39.557315
# HELP atlas_ping_received Number of received icmp repsponses
# TYPE atlas_ping_received gauge
atlas_ping_received{asn="13030",dst_addr="2001:678:1e0::1",dst_name="bb1.ix.dus.routing.rocks",ip_version="6",measurement="8809582",probe="29568"} 0
atlas_ping_received{asn="3320",dst_addr="2001:678:1e0::1",dst_name="bb1.ix.dus.routing.rocks",ip_version="6",measurement="8809582",probe="29337"} 3
# HELP atlas_ping_sent Number of sent icmp requests
# TYPE atlas_ping_sent gauge
atlas_ping_sent{asn="13030",dst_addr="2001:678:1e0::1",dst_name="bb1.ix.dus.routing.rocks",ip_version="6",measurement="8809582",probe="29568"} 0
atlas_ping_sent{asn="3320",dst_addr="2001:678:1e0::1",dst_name="bb1.ix.dus.routing.rocks",ip_version="6",measurement="8809582",probe="29337"} 3
# HELP atlas_ping_size Size of ICMP packet
# TYPE atlas_ping_size gauge
atlas_ping_size{asn="13030",dst_addr="2001:678:1e0::1",dst_name="bb1.ix.dus.routing.rocks",ip_version="6",measurement="8809582",probe="29568"} 0
atlas_ping_size{asn="3320",dst_addr="2001:678:1e0::1",dst_name="bb1.ix.dus.routing.rocks",ip_version="6",measurement="8809582",probe="29337"} 48
# HELP atlas_ping_success Destination was reachable
# TYPE atlas_ping_success gauge
atlas_ping_success{asn="13030",dst_addr="2001:678:1e0::1",dst_name="bb1.ix.dus.routing.rocks",ip_version="6",measurement="8809582",probe="29568"} 0
atlas_ping_success{asn="3320",dst_addr="2001:678:1e0::1",dst_name="bb1.ix.dus.routing.rocks",ip_version="6",measurement="8809582",probe="29337"} 1
# HELP atlas_ping_ttl Time-to-live field in the response
# TYPE atlas_ping_ttl gauge
atlas_ping_ttl{asn="13030",dst_addr="2001:678:1e0::1",dst_name="bb1.ix.dus.routing.rocks",ip_version="6",measurement="8809582",probe="29568"} 0
atlas_ping_ttl{asn="3320",dst_addr="2001:678:1e0::1",dst_name="bb1.ix.dus.routing.rocks",ip_version="6",measurement="8809582",probe="29337"} 57
Scraping configuration for Prometheus
In this example the exporter is reachable at atlas-exporter.mytld and listening for HTTP connections on port 9400. I want to scrape the current result of the example measurement every 5 minutes.
  - job_name: 'atlas_exporter'
    scrape_interval: 5m
    static_configs:
      - targets:
        - 8809582
    relabel_configs:
      - source_labels: [__address__]
        regex: (.*)(:80)?
        target_label: __param_measurement_id
        replacement: ${1}
      - source_labels: [__param_measurement_id]
        regex: (.*)
        target_label: instance
        replacement: ${1}
      - source_labels: []
        regex: .*
        target_label: __address__
        replacement: atlas-exporter.mytld:9400
Metrics and labels by measurement type
This is a list of all metrics currently supported in version 0.5 of atlas_exporter
ping
| Name | Description |
|---|---|
| atlas_ping_success | Returns 1 if the probe was able to reach the target otherwise 0 |
| atlas_ping_min_latency | Minimum latency of all ECHO requests in ms |
| atlas_ping_max_latency | Maximum latency of all ECHO requests in ms |
| atlas_ping_avg_latency | Average latency of all ECHO requests in ms |
| atlas_ping_sent | Number of packets sent |
| atlas_ping_received | Number of packets received |
| atlas_ping_dup | Number of duplicate packets received |
| atlas_ping_ttl | Time-to-live field in the response |
| atlas_ping_size | Size of the ICMP packet in bytes |
traceroute
| Name | Description |
|---|---|
| atlas_traceroute_success | Returns 1 if the probe was able to reach the target otherwise 0 |
| atlas_traceroute_hops | Number of hops |
| atlas_traceroute_rtt | Round trip time in ms |
DNS
| Name | Description |
|---|---|
| atlas_dns_success | Returns 1 if the probe was able to reach the target otherwise 0 |
| atlas_dns_rtt | Round trip time in ms |
NTP
| Name | Description |
|---|---|
| atlas_ntp_poll | Poll interval in seconds |
| atlas_ntp_precision | Precision of the server's clock in seconds |
| atlas_ntp_root_delay | Round trip delay in seconds |
| atlas_ntp_root_dispersion | Total dispersion in seconds |
| atlas_ntp_ntp_version | NTP version |
HTTP
| Name | Description |
|---|---|
| atlas_http_success | Returns 1 if the probe was able to reach the target otherwise 0 |
| atlas_http_result | HTTP return code |
| atlas_http_version | HTTP version |
| atlas_http_body_size | Body size in bytes |
| atlas_http_header_size | Header size in bytes |
| atlas_http_rtt | Round trip time in ms |
| atlas_http_dns_error | Returns 1 if DNS resolving failed |
SSLcert
| Name | Description |
|---|---|
| atlas_sslcert_success | Returns 1 if the probe was able to reach the target otherwise 0 |
| atlas_sslcert_version | SSL/TLS version |
| atlas_sslcert_rtt | Round trip time in ms |
| atlas_sslcert_alert_level | Status of the SSL/TLS certificate (0 = valid) |
| atlas_sslcert_alert_description | Description for the alert level (see RIPIE Atlas documentation) |
Comments 2
Comments are disabled on articles published more than a year ago. If you'd like to inform us of any issues, please reach out to us via the contact form here.
John Todd •
Very useful tool - thanks! I suspect many are running it but keeping quiet about it. :-) We use it to ingest DNS data for our service. I've had someone create a pull request to also store the NSID and first RDATA, since either (or both) of those are extremely useful for DNS resolver operators to determine where the result is coming from, and that is one of the core reasons we're using atlas_exporter in the first place. If you could take a look at it that would be great! Thanks for the good work.
takahiro masuda •
A lot of these guides I see regarding prometheus and such, assume everybody is a devops person. Can someone make a more comprehensive guide from start to finish for us network people? First time using prometheus and it's really difficult to get through this.