
There are all kinds of reasons why RIPE Atlas probes might become disconnected. So, even though we'd like all probes to be connected all the time, disconnects can also tell us a useful story.
Internet connectivity is important. As part of RIPE Atlas, we have a signal that tells us if the RIPE Atlas probe is connected to our controlling infrastructure or not. The "winning" projects ("Disco" and "Halo") from two of our RIPE NCC hackathons featured visualisations of probe disconnects. Now we also have a scientific result: bursts of probe disconnects can help us to find relevant and interesting events on the Internet.
Bursts of disconnects
But what if there are just a handful of probes in an area? In that case, we might not be able to detect bursts or to say anything definite about the full state of the Internet in a specific geographic area or in specific networks in that area. On the other hand, each individual RIPE Atlas probe tells a little story about Internet connectivity in that specific geographic location for a specific network.
One thing that has fascinated me since the inception of RIPE Atlas is how heterogeneous the set of RIPE Atlas probes is. The same is true for the Internet. Internet connectivity is vastly different in different parts of the world. Even in places that are geographically very close, Internet connectivity can be radically different; for instance, if you compare Internet connectivity for a probe at home to a probe in a data centre.
So, the insight we can gain from connected or disconnected probes depends on the density and diversity of the probes we have in a given area.
There is a grey area between having a single probe, which just tells the story of that single instance of Internet connectivity, and having a representative probe deployment for advanced things like detecting bursts of disconnects.
Natural disasters and RIPE Atlas
In case of natural disasters, I have this urge to look into what RIPE Atlas can tell us about the state of the Internet in the affected area.
Let's take the case of hurricane Irma as an example. We have 9 probes in the Miami area that were active around the time the hurricane was active. This is too little to provide a comprehensive overview of Internet connectivity in Miami during this natural disaster, but there are still a few interesting stories to tell.
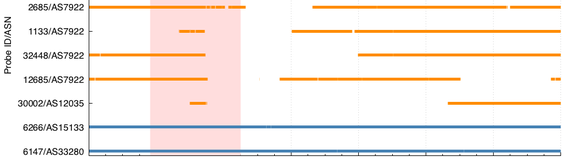
The picture below represents the connection status of the RIPE Atlas probes within a 50 km radius of the Miami city centre.

The horizontal axis shows time, while the vertical axis shows each individual probe. When a probe is 'online' it is shown as a horizontal line, which stops at the moment a probe is disconnected. We've coloured the lines for probes that are behind IPv4 Network Address Translation (NAT) orange, while the others were coloured blue. For the set of probes we're looking at here, we verified that all those behind NATs were located at homes, while those not behind NATs were located in datacentres (this being the typical case).
The first thing to note is that individual probes go online and offline all the time. During the hurricane we saw two probes actually coming back online. We can speculate that something like a brief power cut may have caused probes to reinitialise. It is interesting that datacentre connectivity (blue lines) was not interrupted during this natural disaster, while residential connectivity (orange lines) was heavily affected. The later is hardly surprising since over 92% of households in Miami-Dade county were without electrical power during and after Irma caused disruptions and damage to the Florida peninsula. The fact that datacentre connectivity was hardly interrupted will probably not surprise network operators; datacentres typically have backup power (typically diesel-powered) and there was ample time to prepare.
Do it yourself
We've prototyped how you can create plots like this, and the preliminary code for this is available here:
https://github.com/emileaben/resource-gnuplotter
The image above was created with this command line:
./doit-probe-connects.py -l"Miami,FL,US" -s 2017-09-07 -e 2017-09-21 -o asn --color-by tag:system-ipv4-rfc1918 --annotate irma-annon.json
We hope this tooling is useful to others who quickly want to assess whether RIPE Atlas probes can tell something about the state of the Internet in a particular geographic area.
The RIPE Atlas probe map will soon get a revamp, so some of the ideas that go into this quick prototyping of RIPE Atlas probe connectivity plotting could end up in the probe map revamp. So if people have ideas or suggestions, please let us know now by leaving a comment below.


Comments 1
Comments are disabled on articles published more than a year ago. If you'd like to inform us of any issues, please reach out to us via the contact form here.
Sylvain BAYA •
Hi Emile, I have found your article very useful and instructive, for the case of a natural disaster... Simple 2d plot and easy to understand, because its just helps to visualize disruptions in Internet connectivity. Thanks for sharing ! This would, also, be very useful for the case of Internet Shutdowns... With the cmNOG, we have a little idea of project [1], which aims to monitor Internet Connectivity in our country. So we are still trying to disaminate probes|anchors inside our Networks [2], to have a critical number before launching it [1]. As we are not sure to have the right skill, to locally achieve the project ; we'll probably contact you for help|assistance... Regards, --sb. __ [1]: https://www.cmnog.cm/dokuwiki/IdeasAndProjects/Ideas/StatusCm [2]: https://www.cmnog.cm/dokuwiki/IdeasAndProjects/Projects/AtlasCm