
This is the third in a series of articles in which we look at traffic statistics at Internet Exchange Points during the European Championship currently taking place.
Please also note the first two articles in this series:
- Internet Traffic During the European Championship 2012
- Internet Traffic After First Round of Euro 2012 Matches
- Internet Traffic During Euro 2012 - Quarter-finals
-
Internet Traffic During Euro 2012 - Final Conclusions
Since we and Euro-IX started looking at IXP traffic statistics during Euro 2012, we have seen that the data graphs from some of the IXPs are showing consistent patterns of traffic lows and highs during football matches.
As the group stages come to an end, we do notice that those patterns are in some cases becoming more pronounced as the tournament progresses. In the final matches in each group, which began on 16 June, the matches are held simultaneously, so the graphs we show from that date only highlight two halves of football rather than the four halves when games were held at different times.
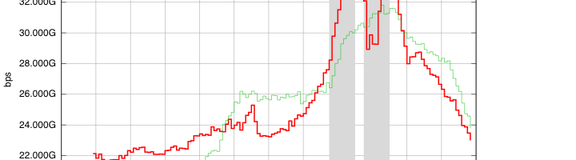
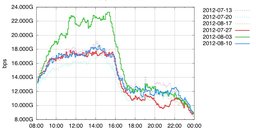
If we look at data over the tournament from INEX (Ireland), we see the familiar peaks and troughs associated with the matches. For the game on 18 June, Ireland’s last game of the tournament, traffic going through INEX reached an all-time high of 34.317 Gbps for that exchange (Figure 1).

Figure 1: Traffic from INEX showing “double bump” during matches on 18 June 2012. Matches: Spain v Croatia and Ireland v Italy
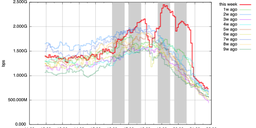
As can be seen in the previous article , the Rostov-on-Don Internet Exchange in Russia showed a marked uptick in traffic during matches. However, if we look at the Samara exchange, also in Russia, we typically only saw modest traffic increases during games up until 18 June, when we saw a huge uptick (Figure 2). It is interesting to see the differences in traffic rates between exchanges of similar size in the same country. Does Rostov-on-Don’s proximity to Euro 2012 host cities in Ukraine have a bearing on this, or is it for completely different reasons? And will the fact that Russia has been eliminated from the tournament have an effect as the tournament moves to the knockout rounds?

Figure 2: Traffic from SMR-IX showing large uptick in traffic during matches on 18 June. Matches: Spain v Croatia and Ireland v Italy
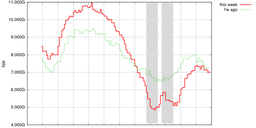
At GigaPIX (Portugal) during Portugal’s final group game with the Netherlands, we see the noticeable and familiar “double dip” for the two halves of the game with an increase at half time and you see traffic returning to normal once the game is over (Figure 3a). The graph for the very next night (Figure 3b) shows a much less dramatic graph with no noticeable half time bump when the Portuguese team is not involved, and it will be interesting to look at aspects such as these as some teams progress further in the competition.

Figure 3a: Traffic from GigaPIX showing “double dip” during matches on 17 June. Matches: Portugal v Netherlands and Germany v Denmark

Figure 3b: Traffic from GigaPIX showing no “double dip” on 18 June. Matches: Spain v Croatia and Ireland v Italy
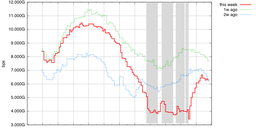
Sometimes the signal we see at exchanges is quite faint and appears only when certain teams are playing. An example of this is UA-IX (Ukraine Internet Exchange) when the Ukrainian national team is playing. The graphs from 15 June and 19 June are examples of when Ukraine was playing. These graphs show deviations correlated with times when the game was in progress (Figures 4a and 4c). The game on 15 June is particularly interesting because the first half was stopped after five minutes, then resumed at 17:00 UTC. For all three periods when the game was on we see drops in traffic levels. The graph from 16 June (Figure 4b) is a typical example of when the Ukrainian national team was not playing, and it shows no deviation from the norm.

Figure 4a: Traffic from UA-IX showing drops in traffic when the Ukraine vs. France game was in progress on 15 June (first three grey areas), but not when the England vs Sweden game was in progress (last two grey areas).

Figure 4b: Traffic from UA-IX showing no deviation from the norm during matches on 16 June. Matches played: Greece v Russia and Poland v Czech Republic

Figure 4c: Traffic from UA-IX showing slight “double dip” deviation from the norm during matches on 19 June. Matches: Ukraine v England and France v Sweden
The quarter finals begin on 21 June when the Czech Republic takes on Portugal. Something to consider as we look at the graphs is whether the amount of traffic we see at the IXPs relates to the size of the dips and peaks we see during matches. We’ll continue to look at the data over the knockout rounds to see if the current trends continue or if the increased importance of matches, as well as possible extra time and penalty shoot-outs, will have an effect on the IXP traffic rates.
Participating IXPs with links to their statistics pages:


Comments 3
Comments are disabled on articles published more than a year ago. If you'd like to inform us of any issues, please reach out to us via the contact form here.
Florian Hibler •
I am not quite sure, if UA-IX can be representative for international traffic, because it is super-restrictive for international members. So this would be national traffic only.
Fergal Cunningham •
Hi Florian. Good point. This is possibly why we're seeing the deviations just for the Ukraine games?
MK •
do not forget for GeoIP restrictions. Specially for video streams and VoD.