Since the first RIPE Atlas probes we handed out at the RIPE Meeting in Rome in November 2010, a lot of progress has been made. There is a lot of interest in these probes and in the measurement results. We were happy to see that we surpassed our original goals quite quickly. Now the number of probes out there is sufficient to look at first results.
Worldwide measurement network
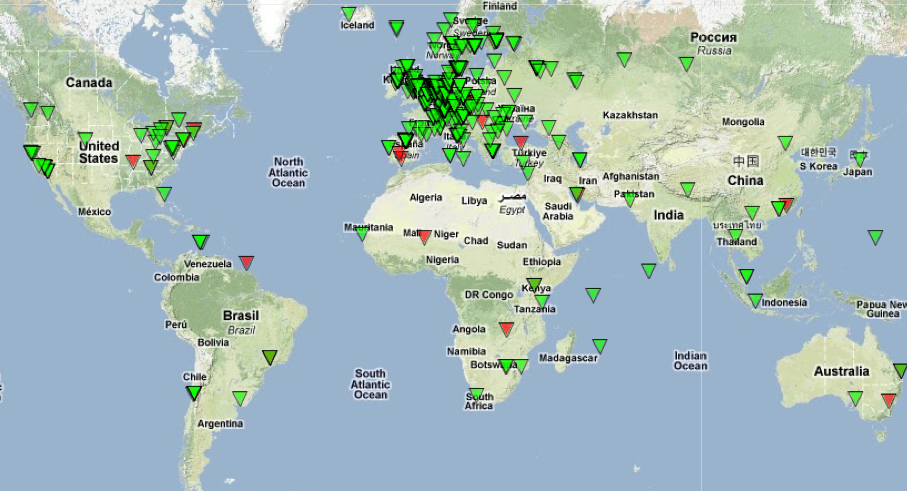
Currently over 380 probes are deployed worldwide. On the map below you can see the distribution of all probes currently plugged in. Green triangles indicate probes that are up and running, and red probes represent probes that are temporarily down (apologies to those countries that did not fit on the image).
 Figure 1: Map showing RIPE Atlas probes distributed around the world
In addition to that, 900 more applicants are waiting for a probe. We are very happy about this overwhelming interest. Unfortunately we do not have an infinite number of probes. Therefore we are now distributing them based on location and network topology. Please understand that it can take some time until you receive your probe.
Initial results
With all these measurement devices plugged in at so many different networks worldwide, we already see some interesting results.
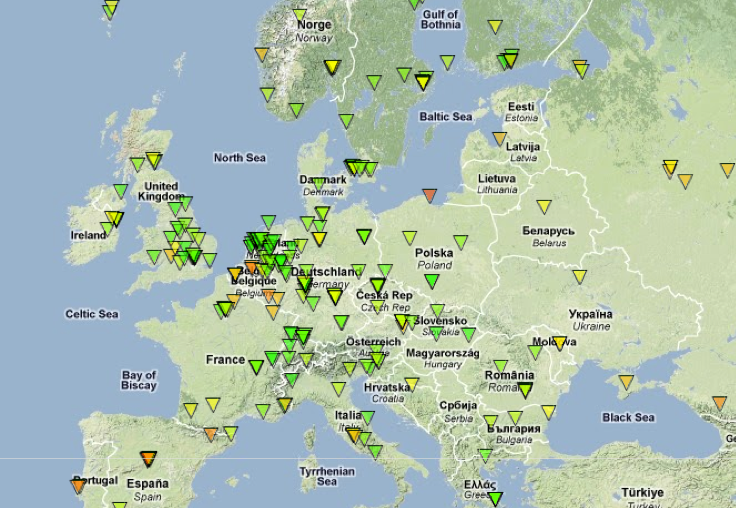
The map below shows the round trip time (RTT) for packets seen from probes to the destination, in this case K-root, the root server operated by the RIPE NCC. Each triangle represents one probe. The colour of the triangle indicates the RTT: dark green = 10 ms, light green = 30 ms ..., red = more than 300 ms. (clicking on the image will bring you to a web page that shows the current status).
 Figure 2: Map showing round trip times from Atlas probes to k-root server in Europe
High values of RTT can be caused by various things: Some networks are connected to the Internet with dial-up connections, or even by satellite, which naturally results in a high RTT. Another reason for a red triangle could be network congestion which increases the RTT from the probe to the root server. In some rare cases, it could also be that the probe tries to reach an instance of k-root that is far away instead of the one that is closest to the probe. K-root is anycasted and has instances in multiple locations which allows networks (and Atlas probes) to connect to the nearest one.
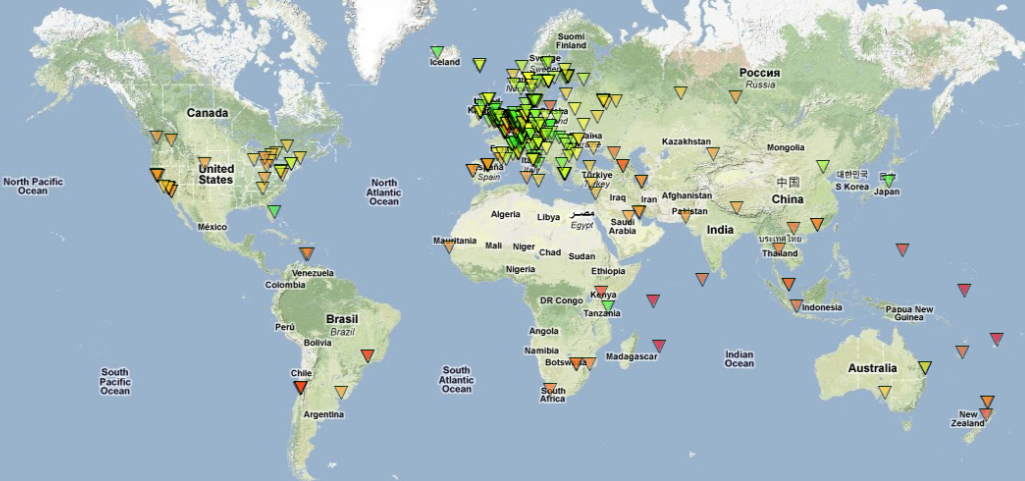
The image below is showing a bigger part of the world map. You can see that Atlas probes located far away from K-root instances have a higher RTT and those that are close to an anycast instance of K-root show a shorter RTT. For example, the Atlas probe in Tanzania is represented by a green triangle, because an anycast instance is located in the region.
 Figure 3: Map showing round trip times from Atlas probes to k-root server globally
Having this measurement data presented like that, makes it easier for network operators to detect configuration errors or to make conscious decisions about changing their network configurations in order to reach better results (i.e. lower RTT values).
As a next step we will work on user-defined measurements which will allow probe hosts to determine which type of measurements their probe should perform. One could imagine queries like ping, traceroute, DNS queries and possibly even HTTP queries. We will start with ping, and then move on to the others.
For more information on RIPE Atlas, please refer to the RIPE Atlas pages on RIPE Labs.


Comments 0
Comments are disabled on articles published more than a year ago. If you'd like to inform us of any issues, please reach out to us via the contact form here.