
The World Cup is one of the most watched events on the planet, and we've been looking at traffic changes at Internet Exchange Points during the matches in Brazil at World Cup 2014. The final part of our analysis is now available, with a look at what happened during the final four matches of the tournament (section 4).
Table of Content
- Introduction
- World Cup statistics during group stages
- World Cup statistics during round of 16 and quarter finals
- World Cup statistics during semi-finals and finals
- Conclusions
-
List of participating IXPs
1. Introduction
The FIFA World Cup 2014 is currently taking place in Brazil. It is the most watched sporting event in the world. We are teaming up again with Euro-IX (The European Internet Exchange Association) to look at Internet Exchange Point (IXP) traffic during the championship
Through collaboration with Euro-IX we are in the position to collect, in one place, the public data available from a number of Internet Exchange Points (IXPs) across Europe, and even beyond. These IXPs, which connect ISPs, make up a large constituency in the RIPE NCC membership and play a very important role in the global Internet community. For an introductory video to how the Internet works and what the role of the IXPs is, we recommend watching Euro-IX's "Internet Revealed" movie .
Please note that IXP traffic is not indicative of the overall Internet traffic in a country or region. IXPs connect the networks of ISPs to permit the exchange of Internet traffic. The traffic that goes through IXPs represents only a sample of all Internet traffic. Notably, private interconnects between networks and traffic that stays within an ISP because of local caches/CDNs will naturally not be visible at an IXP.
However, it is interesting to observe different user behaviour compared to traffic during non-World Cup weeks: We see either:
- An increase in traffic, because more people use the Internet to watch the games and communicate about them with their friends (let's call that plus-traffic ); or
- A decrease in traffic, because people use the Internet less, for instance because they are watching the games on TV or in a pub (let's call that minus-traffic )
At the IXPs (or any other data aggregation point) we see a specific biased view of traffic at that point:
- A peak is expected if plus-traffic is observed across the IXP
- A drop is expected if minus-traffic is typically observed across the IXP
- We don't expect any signal if no plus- or minus-traffic is observed across the IXP
- Plus- and minus- traffic levels can cancel each other out
2. World Cup statistics during group stages
Friday, 13 June 2014: The Netherlands vs. Spain
AMS-IX
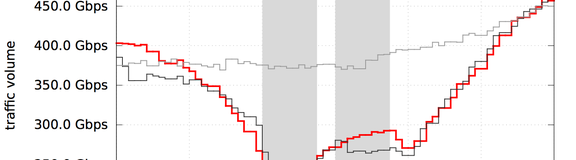
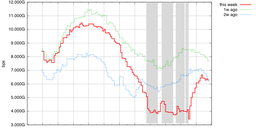
Figure 1 below is a most striking example of decreased traffic at a big exchange (AMS-IX) during the Netherlands-Spain game. This and all following graphs show a specific day of the week in red (in this case Friday, 13 June 2014), and the same day of the week in the weeks before as grey lines. Game times are indicated as grey rectangles in the background, and the official FIFA country codes for the countries playing at that time are at the bottom of these rectangles.

As you can see in Figure 1, the game between Spain and the Netherlands correlates with two distinct drops ("double dip") in traffic at the same time as the two halves of the football game and also a slight but distinct dip right after the game (celebration?).
If we compare the traffic volume during the Netherlands-Spain game to the week before, there is a difference of 256 Terabytes: Users either caused traffic elsewhere (streaming over private connects?) or just reduced their Internet usage. Or in other words: 256 Terabytes of data "went missing". That's a lot of data! To put it into perspective, that is 1.8 trillion tweets. Alternatively, you'd need over 400,000 people to be streaming movies at standard quality (0.3 GB/hr) for two hours continuously to make up for that.
Monday, 16 June 2014: Germany vs. Portugal
INEX
Figure 2 below shows a clear drop in traffic at the Irish Internet Exchange (INEX) during the Germany/Portugal game (red line at 16:00 UTC). The drop relative to normal traffic levels continues until well after the match (people in the pub still talking about the match?), which is a bit atypical. Correlation and causation are two different things, so obviously we're not sure how strong the tie between the football match and the traffic drop actually is here, and what part of the drop can be explained by normal variation of traffic and/or other events.

Tuesday, 17 June 2014: Russia vs. South Korea
MSK-IX
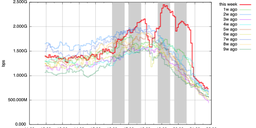
Figure 3 below shows the traffic statistics for the Moscow Internet Exchange (MSK-IX) in Russia. On Tueday, 17 June 2014 during the Russia-South Korea game we observed a small increase in traffic (red line, most noticeable between 23:00 UTC and midnight).

As the traffic volumes for this exchange were very similar the weeks before the game and different and slightly up during the match, this could be one of the examples where we actually observe plus-traffic , potentially live video-streaming hitting the exchange.
If people know about the local situation in Moscow (or anywhere else) with regards to live-streaming of football matches, we'd love to hear in the comments section below.
NSK-IX / RDN-IX
Figures 4 and 5 below show the traffic statistics on Tuesday, 17 June 2014 observed at the Novosibirsk Internet Exchange (NSK-IX) and Rostov-on-Don Internet Exchange (RDN-IX) in Russia. At both these exchanges we see traffic peaks during the Russia-South Korea game that started at 22:00 UTC. These exchanges are lower volume than the Moscow exchange, which could explain the peaks standing out more clearly.


Monday, 23 June 2014

This exchange is an interesting case of either plus- or minus-traffic , depending on who's playing. It hints at Brazilians using the Internet less during games they are most passionate about (and go watch on TVs, in bars, on squares?), but increase their Internet use during other matches.

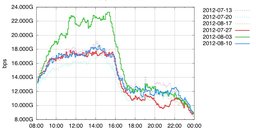
Please note that we only started collecting data from this IXP when the World Cup started, so we don't have data from the weeks before that we can add to the graphs. However, we took a couple of screen shots (Figures 7 and 8 below) from PTT's Sao Paolo MRTG graphs and from that the different pattern during Brazil matches is easily recognisable.
The first graph shows the traffic on normal days during the week from 5-12 June (we tweeted about this one). On 12 June, the tournament started with the Brazil-Croatia match - marked by the red arrow. The second graph shows the following week. Again, the Brazil matches are marked.


Additional Data
We found some additional data that further visualises the behavioural change of people during the world cup.
Akamai provides information about the volume of World Cup traffic they observe (see Figure 9). Not surprisingly, Akamai sees large peaks of traffic correlated to the games. The peaks in Akamai traffic contrast with the dips we see at IXPs. This shows how your vantage point really affects what traffic patterns you see.

We also found familiar "double dip" patterns in data others reported about the World Cup: Below in Figure 10 you can see the water usage in Berlin, Germany on 21 June 2014. During the two halves of the Germany-Ghana game, the water usage went down, while during half-time it went up significantly and higher than before or after the match.

Do you know of any other interesting Internet-related World Cup source of information? Please consider sharing it with the rest of us Internet-and-Football-loving people by commenting below!
3. World Cup statistics during round of 16 and quarter finals
The group stages ( see above ) at World Cup 2014 were widely considered to be the most exciting in World Cup history. And as the tournament entered the last 16 and quarter finals, new elements came into play that gave us new data points to look at - extra time and penalty shootouts.
The effect of extra time and penalty shootouts
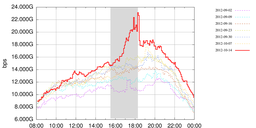
With the tournament in the knock-out phase, a new type of signal popped up due to games being extended by extra time (two halves of 15 minutes) and sometimes even penalty shootouts. A clear example of the effect of this is the traffic at the IXP in Sao Paolo on the day Brazil played against Chile on 28 June 2014.

Like before, traffic here drops during the game involving Brazil. This game went to extra time, during which traffic also stayed uncharacteristically low, and eventually ended in a penalty shootout (indicated in yellow in Figure 11). The shootout must have kept the Brazilians on the edge of their seats, because right after, we see a distinct dip in traffic for about 15 minutes (green arrow). We can only imagine the relief and partying by Brazilians that this dip in traffic represents.
During the Netherlands-Costa Rica game on 5 July, a similar penalty-shootout-effect is visible on the Amsterdam Internet Exchange AMS-IX (see Figure 12 below). The yellow line indicates the time of the penalty shootout. Right after the penalty shootout, traffic drops for about 10 minutes (relief?), which is in line with traffic in the previous weeks, but some 20 minutes after the penalty shootout we see a small but distinct increase in traffic (euphoria?).

The Dutch media also reported increases in phone calls, SMS and Internet usage (in Dutch) during the break and after the penalty shootouts.
The effect (or lack of it) in Germany
We were asked why we previously showed graphs from the Irish exchange point (INEX) for a game involving Germany, and not graphs from the German IXP DE-CIX, as it is one of the larger exchanges. The answer to that is that we didn't see any interesting effects on DE-CIX Frankfurt or any of the other German exchange points such as BCIX and ECIX during matches involving Germany. The round-of-16 match between Germany and Algeria was no exception. It was not that the Germans didn't care: The German press reported a record number of people watching the game on television during that particular match (in German).
To our surprise, on the day Germany played against France during the quarter-finals, DE-CIX Frankfurt did show a slightly different pattern. Traffic levels that day started out pretty normal, but roughly two hours before the France-Germany match, traffic levels didn't increase like they normally do. In fact, traffic levels stayed in the order of 100 Gbps under their normal levels roughly until the Brazil-Columbia game started later that evening (see Figure 13 below). We're unsure how much this drop has to do with the game. Did Germans en masse start their weekends early in preparation for the match?

Additional data and interesting facts
1. Predating our efforts, at NANOG 38 (2006), Yukiyasu Tarui from JPNAP analyed the impact of major social events on Internet exchange traffic and showed similar pattens to the ones we observed at various IXPs.
2. In the UK, the national power grid observed large surges in electricity demand during half time corresponding to half a million people putting on the kettle to make a cup of tea before the second half of the game.
3. Twitter observed an interesting pattern during the penalty shootout of the Brazil-Chile game on 28 June 2014, the same shootout as in Figure 1 above. Figure 14 shows this twitter perspective, which shows a data point every second. The IXP data shows a data point every five minutes. It is fascinating how the high-granularity twitter data shows the effect of the penalty-shootout on a micro-scale.

4. World Cup Statistics during semi-finals and final
In the final four matches of World Cup 2014, fans will have experienced a rollercoaster of emotions, from exhiliration and devastation to profound boredom.
The highs and lows of the action on the field were at times reflected in the Internet statistics from IXPs and other Internet sources.
Tuesday, 8 July 2014: Germany vs. Brazil
This first semi-final was a game full of drama for sure. In fact, it was the most tweeted single sports game of all times (see Figure 15).

What we see on the Brazilian exchanges was a familiar drop in traffic for the two halves, but with a twist: somewhere during the first half the traffic started to increase again. Figure 16 below shows this effect for the PTT Sao Paolo IXP, as compared to an earlier game Brazil played and an earlier day during the tournament when no games took place.

The flurry of German goals during the first half of this semi-final must have put a dagger in any football-crazy Brazilian heart. Cold, hard IXP traffic statistics seem to correlate to that, but they leave us speculating as to how an increase in traffic would be caused by Brazilians seeking solace.
This game had effects everywhere, and the LINX exchange in London was no exception. Since this IXP has two separate interconnect infrastructures in London (called "London Extreme LAN" and "London Juniper LAN"), it allows us to look at two different traffic mixes in the same location (Figure 17 and 18).


Not surprisingly, the traffic levels on the Extreme and Juniper LANs are different and show different peaks and dips. The Extreme LAN traffic volume shows a familiar double-dip during the Germany game, even though traffic had its up- and down-swings earlier that day, and also on the Tuesdays the weeks before. With the Juniper LAN the potential effect of this match is much more in the noise, showing that it really matters what traffic aggregate you are looking at for what effects you will see.
LONAP in London, tweeted about seeing an almost record high in their traffic:
Yesterday we did see a traffic spike during the World Cup game but it was 1.1Gbit off the alltime peak caused by an Apple software release.
— LONAP (@lonap) July 9, 2014
Figure 19: LONAP tweet after Brazil vs. Germany game
Wednesday, 9 July 2014: The Netherlands vs. Argentina
To describe the second semi-final as a tad more boring might be slightly kind, apart of course from the nerve-wrecking penalty shootout starting around 22:38 UTC.
Nine million people in the Netherlands watched the game on TV (a record figure). The IXPs that we reported on earlier show familiar patterns. The fact that the penalty shootout was of the nail-biting variety is maybe exemplified more by a couple of examples of traffic levels to "big-content". A few organisations kindly put highly granular data online for public consumption. Figures 20 and 21 are screenshots of two of these examples - both show big decreases in user traffic at the time of the penalty shootout. These could be caused by anything really, but the pattern in these unrelated datasets is definitely there.

Figure 20: Page views per second to Wikimedia front-end servers (includes Wikipedia) covering the evening of 9 July. Regular time for the Netherlands-Argentina game is indicated with a red line and a red arrow indicates the time of the penalty shoot-out (Data from Wikimedia ).
![]()
Figure 21: Relative traffic volume to all Google services from users in the Netherlands. Red arrow indicates a drop in traffic after the Netherlands-Argentina penalty shoot-out ( Data from Google transparency - note that this data was beyond the point where Google calls data finalised).
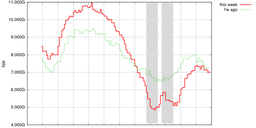
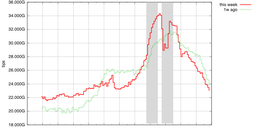
A similar effect is visible on the CABASE NAP in Buenos Aires, Argentina. We didn't get raw traffic stats from this IXP in time to be able to compare to previous weeks, but screenshots of the daily and weekly traffic stats here in Figure 22 and 23 show a similar pattern of traffic drops. Note that 9 July was also Argentinian Independence Day , which also affects people's behaviour in ways that might be seen at an IXP.
![]()
Figure 22: Weekly traffic at CABASE NAP in Buenos Aires. The difference between IN (green) and OUT (blue) traffic is traffic handed off to any of the other 11 NAPs that CABASE serves. The red arrow indicates the Netherlands-Argentina game.
It is interesting to see from this weekly pattern the increases in IN traffic during games on Friday, Saturday, Tuesday and slightly on Wednesday, while a decrease in OUT traffic on Wednesday is only seen during the Netherlands vs. Argentina match. The daily graph clearly shows a dip in traffic during the penalty shoot-out.
![]()
Figure 23: Daily traffic at CABASE NAP. The Red arrow indicates the penalty shoot-out time for the Netherlands-Argentina game.
Saturday, 12 July 2014: Brazil vs. Netherlands
Even though a game for third place doesn't matter much to some, IXP stats hint at significant interest still as shown in the traffic at AMSIX (Figure 24 below).

The pattern is similar to 5 July when the Netherlands played Costa Rica at the same time of day. A clear drop in the first half, and something less clear in second half. The pattern is quite similar, except for when the 5 July game went into extra time and penalties, but the absolute traffic rate is some 100 Gbps less. Maybe this says something about the relative interest in this game?
Sunday, 13 July 2014: Germany - Argentina
By this time, readers will likely be familiar with the patterns to expect from world cup football games, so at this time showing another graph showing double dips would become repetitive and boring. So, instead here is a picture of a cat watching the football:

That means there are no big surprises in the IXP statistics at this point. If you want to have a closer look at the participating IXP's data, please follow the online IXP traffic statistics from the links below.
This tweet from an IXP not on our hitlist below is interesting though:
Traffic at start of extra time is 3.7Gbit, if #GER v #ARG goes to pens will we beat the 3.9Gbit seen in Brazil game? pic.twitter.com/aBbFE4xCYF
— IXLeeds (@ixleeds) July 13, 2014
Figure 25: IX Leeds Tweet during Gemany vs. Argentina
5. Conclusion
With everything that is happening in the world today, football might sometimes seems insignificant, but apparently it affects a significant part of this planet's population. For example, reports from Germany indicate that 35 million people watched the World Cup final - an all-time high. Internet traffic statistics seem to confirm this; sometimes, at key moments in football matches, the Internet seems to miss a beat.
For network operations, knowing that events will cause changes in traffic helps in being prepared. But it's not only streaming traffic that causes increases in demand during big sports events like this. Other traffic may very well decrease significantly. If you have to pay for that on a 95th percentile basis, these expected decreases might even provide opportunities.
And so as the World Cup ends many of us can get back to a normal life that includes going to bed at a reasonable hour. We hope you find the IXP stats interesting, and if you have your own observations about Internet behaviour during events like this, please add them to the comments below.
And, finally, congratulations to Germany and thanks to all who provided us with the data to make this article possible.
6. List of participating IXPs
Thanks to all the IXPs that participated (the links below point to the statistics pages of the IXPs).
Please note that we are looking at general trends and the most interesting behaviour. Therefore not necessarily all available IXP statistics are included in this article.


Comments 4
Comments are disabled on articles published more than a year ago. If you'd like to inform us of any issues, please reach out to us via the contact form here.
Ruben van Staveren •
Sure this is 256 Terabytes? Thought amsix maxed around ~2.6TB. Other than that, wonderful insight!
Hide replies
Emile Aben •
ams-ix maxed out at ~ 2.5 Tbit per second that day. Say over the course of the 2 hrs where we see reduced traffic, the difference between a normal day and that day was (by eyeball) roughly 200 Gbit per second. So to convert to a volume that is: 200 Gbps * 7200 s / 8 bits = 180 TBytes The above is an estimate, for the article I actually used the underlying raw data to calculate the 256 TBytes. If I missed something, let me know and I'll happily correct it.
Dan Proctor •
Interested in repeating this analysis for 2018 world cup?
Hide replies
Emile Aben •
Hi Dan, we have no plans of repeating this analysis this time. This type of signal is still there, see for instance https://twitter.com/search?q=%40ohohlfeld%20%23worldcup&src=typd for a couple of graphs that show the impact in various places.