
With the depletion of the IPv4 free pool in the APNIC region and the imminent IPv4 free pool run out in the RIPE NCC's service region, it is interesting to look at IPv4 allocation rates per country to see where free pool run out has and will have the most consequences, in terms of curtailing growth of IPv4 address usage. In this article, we try to visualise where "the pressure is on" the most.
2011 was an interesting year for IP address allocation. Geoff Huston has a good overview of trends and analysis . The major milestones were the allocation of the last five IPv4 /8 blocks from the IANA to the Regional Internet Registries (RIRs) and the APNIC region reaching their final /8 .
In this short article we look a bit closer at the growth in 2011 of IPv4 address space allocated or assigned to organisations on a country level, and what this might tell us for 2012. The underlying assumption of this analysis is that growth rates for 2011 will be a rough estimate for the desired growth rates in 2012 (but as usual, results from the past are no guarantee for the future). Where large pools of allocated and assigned address space already exist, there is more room for improving efficient utilisation of these resources. The main difference between 2011 and 2012 is that APNIC will be allocating from their final /8 and the RIPE NCC will possibly hit this milestone as well. All RIRs have special policies in place for their last /8, which restrict the amount of address space each organisation can get.
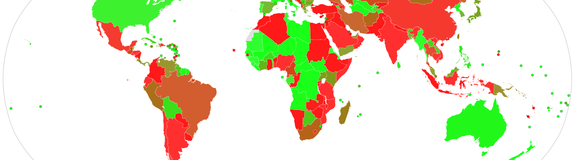
Figure 1 shows how much the IPv4 address pool handed out from the RIRs to organisations in specific countries has grown from 1 Jan 2011 to 1 Jan 2012.

Figure 1: Growth of IPv4 address pool handed out from the RIRs to entities in specific countries. Countries are coloured by growth, going from bright green (0% or less) to bright red (20% or more).
All of the RIR regions (you can find a map of the RIR service regions on the RIPE NCC web site) tell a different story:
The APNIC region was only on a "normal" (ie. not in their last /8s) needs-based IPv4 allocation regime for less than half of 2011, while the other regions were in a "normal" needs-based address allocation regime for the entire year. As a consequence existing organisations in the APNIC region had a shorter period where they could apply for IPv4 address resources under the "normal" needs-based regime. But the Asian part of the region still shows up bright red, indicating large demand.
For the RIPE NCC service region , there is mostly a split between the western part of Europe on the one side, and the rest of the region on the other. While growth in western parts of Europe is generally moderate, the rest of the region shows mostly rapid growth. So when there is no more "normal" needs-based address allocation possible in the RIPE NCC service region, these parts of the region are likely to be affected the most.
The ARIN region already had a relatively large amount of IPv4 addresses delegated to organisations in its region, so it's not surprising the growth in this region is low.
The LACNIC region looks a bit like Asia in terms of high growth rates. The big difference is that LACNIC is not expected to run out anytime soon.
The AfriNIC region is a bit of a mixed bag. Some countries show large growth; for instance the IPv4 address pool allocated or assigned to organisations in Morocco grew by 174%. Other countries show surprising small or no growth. This could in part be explained by conflict situations in 2011.
Conclusion
It is clear that the different RIR service regions will reach their final /8 at different points in time. Although we can predict when this will happen (for instance Geoff Huston's predictions , or you can make your own prediction here ), we don't know exactly when, but we do see that the growth rates in some countries are such, that the effects can be quite different for various parts of the globe. It will be interesting to see how this further develops in 2012.
Methodology
We looked at the RIR stats files from 2011-01-01 and 2012-01-01. From the 2012-01-01 files we took the total allocated and asigned IPv4 address space to organisations aggregated by country, and also calculated what the number of IPv4 addresses per country was on 2011-01-01 based on the timestamps in these 2012-01-01 stats files. This is to take into account additions to the stats files that are backdated from before 2011-01-01. We also compared the 2011-01-01 and 2012-01-01 files for IPv4 address space that disappeared in the latter (reclamation). By adding the "disappeared" address space to the 2011-01-01 number that we already derived, we get to the real IPv4 address space holdings per country and these were used as the basis for calculating growth between 2011-01-01 and 2012-01-01.


Comments 2
Comments are disabled on articles published more than a year ago. If you'd like to inform us of any issues, please reach out to us via the contact form here.
Arturo Servin •
One year of allocation data may be a bit "bursty" I think, does the map change for a two year period?
Emile Aben •
Hi Arturo, The data is what it is, and I'm merely following this peculiar human trend to reflect on the last year in January :) I recreated the map for a 2 year period, ie Jan 1 2010 to Jan 1 2012, and while individual countries change, the regional trends are roughly the same. I put the map here (so these are per-year growth rates over the period Jan 1 2010 to 1 Jan 2012): http://sg-pub.ripe.net/demo-area/countryipsize/ipv4-usage-growth-2010-2012.png