

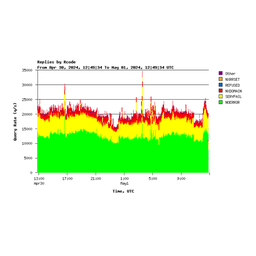
This graph shows TCP queries coming to K-root during 4 hours on 3 June 2010.
The graph below shows the number of TCP queries coming to K-root during 4 hours on 3 June 2010.
We see some interesting peaks precisely every 10 minutes, but we cannot explain what causes them. If you have any ideas, please post them below or let us know by e-mail.


Comments 1
The comments section is closed for articles published more than a year ago. If you'd like to inform us of any issues, please contact us.
Anonymous •
<div class="content legacycomment"> <p> I don't know whether it's related, but we also see periodic peaks in TCP queries on authauritative servers for the ch TLD from time to time. I have analyzed this activity for the interval of about midnight through early afternoon (UTC) today, June 7. The peaks were almost perfectly periodic with a frequency of about 19 minutes (but this is not constant over longer periods of time). I could identify the following criteria common to the queries that dominated the peaks </p> <p> </p> <p> 1) Query flags included the DO bit </p> <p> </p> <p> 2) The bulk of the queries was generated by a small number of IP addresses (<10), heavily dominated by a single address </p> <p> </p> <p> 3) There is a strong correlation with peaks of NXDOMAIN replies, i.e. the TCP queries were almost exclusively for non-existant domains </p> <p> </p> <p> The single address that dominated the effect in this analysys appears to be a name server of an Indian ISP (TATA Communications). Fact 1) and further analysis of UDP queries from this address strongly suggests that the server is behind a broken middlebox that blocks large DNS responses, causing fallback to TCP. I suspect that these peaks are due to a combination of periodic scans of MX records through DNSSEC-aware resolvers that cannot receive large responses. Fact 3) is a bit puzzling, but I've been observing peaks of MX queries for non-existant names within the ch TLD for a couple of years. It would be interesting to see if any of these observations apply to the data from K-root as well. -- Alex </p> </div>