
We started using RIPE Atlas to monitor and improve the services to our customers. We liked it so much that we're now a sponsor!
Background
As a gaming company offering our services worldwide, we wanted an overview of what our connectivity is like in the different countries we serve. Most of the services we tried using for this only measured connectivity between data centres. But we actually wanted data from users in these countries to get a better feeling of the problems our customers face.
What are we interested in?
There are a number of things we need to know in order to maintain and improve our services:
- General reachability: Are we available via the selected providers?
- Latency: Do we have latency problems with some providers in certain countries?
- Historical searchable data: When someone asks "Was there a problem with provider X in Munich last week?", we wanted to have the answer.
Requirements
Some requirements need to be met by any set of data we use:
- Everyone in the operations team should be able to access the data and add and remove measurements.
- It should use our existing logging system (Graylog).
- It should have an open-source toolchain.
- And finally, we wanted to find a project that is supported by an active and helpful community.
RIPE Atlas: From hosting a probe to becoming a sponsor
We looked at different projects and, as we are already a RIPE NCC member and a Local Internet Registry (LIR), we decided to try out RIPE Atlas. It looked very promising, with many probes online worldwide and an open-source toolchain. Plus, I was already a probe host and had watched the webinar .
Getting things running
First we requested a probe and put it on our network to start earning credits to perform the actual measurements. At the beginning, we used our probe to monitor some outside services like Facebook, Twitter and other sites we use for single-sign-on (SSO) only. We used LatencyMon to gather some statistics and to get a feeling for the data we were going to use later on.
Data pays off!
This data helped us track down a reachability issue with Facebook, which at first only manifested itself in slow responses from our SSO system.
Getting more data...
The relatively small amount of data we collected already helped us track down many issues (failing upstream, Facebook problems and so on). We added more measurements and exported the data to Graylog to be accessible by the whole operations team.
Sending data to Graylog
We wrote a Python script that gathers data based on the measurement ID. It can also download historical data for a running measurement.
The script is open source. You can download it from the Graylog marketplace or directly from Github .
It parses the data and sends it to Graylog in a structured format called GELF (Graylog Extended Log Format). It also does a geo lookup based on the coordinates of each probe provided by RIPE Atlas. Finally, this information is stored in a local SQLite database. The data expires after a configurable time period.
See some screenshots of the script below:

Console output

SQLite schema

SQLite data
Data visualisation
You can build graphs based on the GELF fields sent by the script.

GELF fields
Here you can see some dashboards we use on a daily basis to troubleshoot problems:

Dashboard of RIPE Atlas, Europe

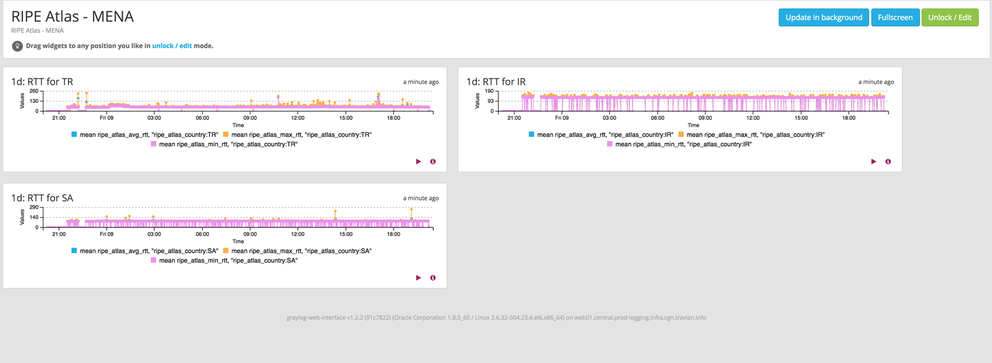
Dashboard of RIPE Atlas, Middle East and North Africa
The data helped us track down an outage of one of our upstreams
One day we received many customer complaints from certain countries that our pages were slow or completely failing to load. So we created some dashboards based on each probe in our measurement and saw that it was only a problem with certain providers. We then used the RIPE Atlas API to create some traceroute measurements to get more data from those providers. We finally found the problem: one of our upstreams had 100% packet loss at this time towards those providers. Even though all of them were from countries where we don't have an office, RIPE Atlas helped us track down the issue in 15 minutes! And we could provide some really helpful data that allowed the upstream to resolve the issue very quickly.
So collecting this data really paid off!
Why did we become a sponsor?
One aspect was to get more credits to perform even more measurements - but that's not the only reason.
We actually gathered really useful data that allows us to mitigate issues faster - before the customers even notice a problem. So we wanted to support RIPE Atlas and give something back.
Next steps: Alerts
The next step will be to set up automated alerts. If more than X probes in a region/provider lose connection towards us or have an abnormal rise in latency, we want Icinga to raise an alert based on the data in Elasticsearch.
Comments 2
The comments section is closed for articles published more than a year ago. If you'd like to inform us of any issues, please contact us.
jamesb2147 •
This is awesome and thank you, Annika and RIPE, for sharing! I was wondering, will you write a post on how you configure Icing to point to your ES instance and alert on it? Once you have it completed, that is. This seems like a very worthwhile project and thanks again!
Annika Wickert •
Hi, thank you very much! Yes, as soon as this part is in production I will contact the RIPE team for a new blog post.