This post introduces the MORIS (Measuring and Observing Representative Information of webSites) probe, a tool for measuring automated web browsing sessions, which allows to estimate end-users’ QoE (Quality of Experience) in various situations and to perform troubleshooting when it is degraded.
The need to monitor web browsing sessions for QoE estimation and troubleshooting
Web browsing, as the main Internet service, needs to offer optimal experience during end-users’ web navigation process, independently of their geographic location, computing power and user profile.
The World Wide Web was originally meant to deliver static content (mainly texts and images) but evolved drastically towards dynamic web pages, composed of various types of objects (images, scripts, audio, video, etc.) delivered by a plethora of content servers all over the globe, transported over various networking technologies, and rendered by different web browsers (Google Chrome, Mozilla Firefox, Microsoft Edge, Apple Safari, etc.).
Currently, there are new trends towards application-level Internet protocols (e.g. Quick UDP Internet Connection (QUIC), the use of proxy-based architectures, leading to deep end-to-end encrypted communications which makes troubleshooting tricky.
Our tool MORIS (Measuring and Observing Representative Information of webSites) allows the automation of web browsing sessions, the evaluation of distant websites’ performance and the understanding of parameters that can contribute or impact performance. The tool takes into account various customisable end-user environments and implements all the current main web metrics. Using MORIS jointly with a networking tool (e.g. RIPE IPmap) which provides knowledge of the network topology, we aim as a whole to identify bottlenecks in web browsing sessions, i.e the domestic network or devices, the internal operator’s network or border network or the distant web server in real time.
The MORIS probe
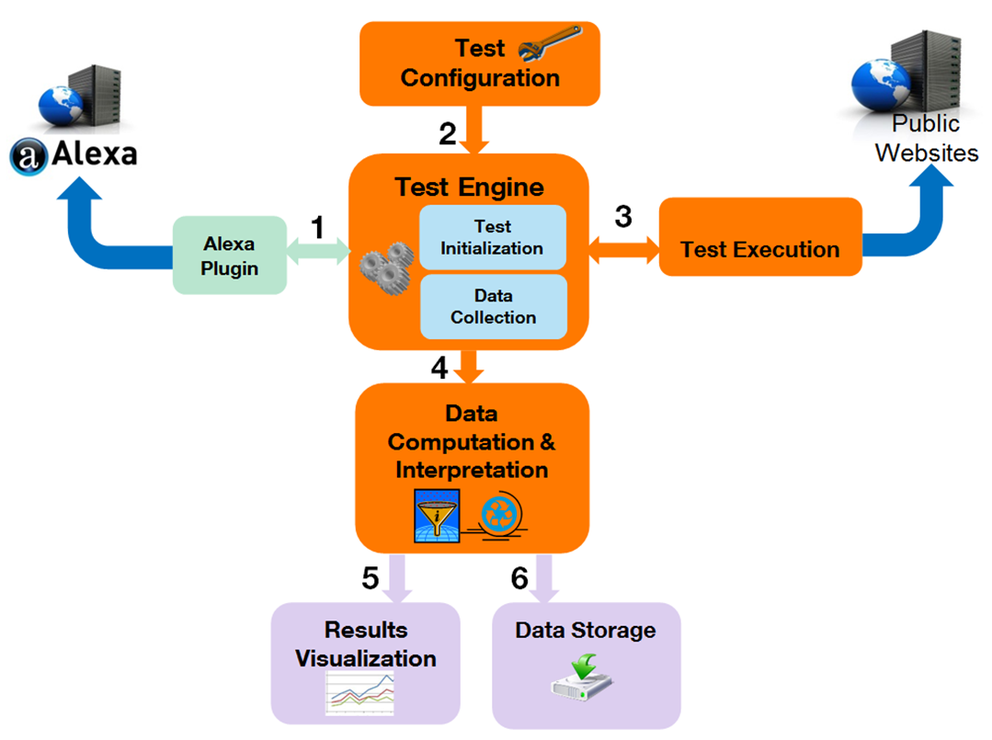
MORIS is a user-oriented measurement tool. The main objective is to perform automated web browsing sessions, measuring and observing representative information of web pages in order to better qualify and understand the perceived QoE and help troubleshooting. Figure 1 shows the main MORIS components.
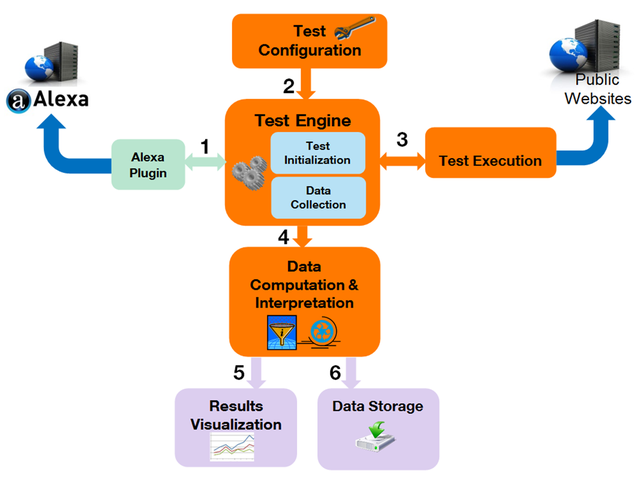
Figure 1 : MORIS architecture
Web browsing sessions can be conducted on a single website (homepage or web navigation) or a set of websites (e.g. Alexa Top Ranked web pages or list of websites), where every browsing parameter is customisable. The parameters can be the preferred protocol (e.g. HTTP/1, HTTP/2, QUIC), the preferred browser (Google Chrome or Firefox), the access network type (ADSL, fibre or Wi-Fi), the browser’s window size, the use of cache and plugins (e.g. ad blockers) or not, etc.
MORIS measures the main web metrics and an automated analysis of the collected information provides fine-grained user-oriented quality indicators:
- PLT (Page Load Time): the time between the first request being sent and the entire web page being loaded
- Resource Timing: characteristics of the downloaded resources, needed to render the web page
- Paint Timing API: measures a web page loading progression through time
- TFVR (Time for Full Visual Rendering): loading and rendering time of each resource in the visible portion of the browser.
MORIS also measures the number of resources composing a web page and provides the geographic location of the corresponding content servers. The tool also exposes the protocol distribution to retrieve the full web page (the Internet protocol through which the resources are delivered can be different from the requested protocol if the distant server does not support it), as well as fine-grained details for each downloaded resource (DNS, request, response and processing time by the browser). Figure 2 shows an example of the the measured data when performing an automated web browsing session towards youtube.com, when using the Google Chrome browser, without an ad blocker, following a window size of 1,440 x 900, with the preferred protocol being QUIC and network access being fibre (500 Mbps down, 200 Mbps up).
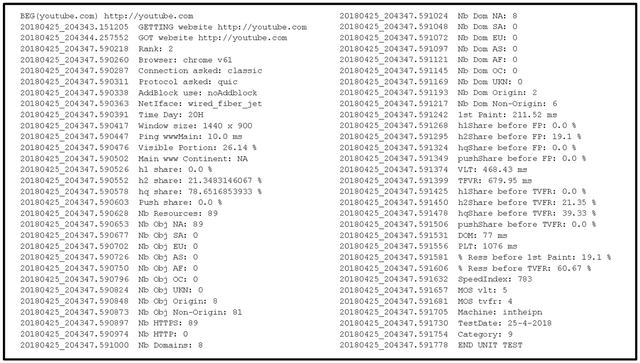
Figure 2 : MORIS monitoring results
As shown on Figure 2, MORIS helps to measure web browsing sessions more finely through time and can be graphically represented as shown in Figure 3. The TFVR calculation exposes for every downloaded resource the network and processing time by simply retrieving the browser’s network and performance logs:

Figure 3 : youtube.com main webpage
MORIS helps to measure web browsing quality. It also helps to identify possible issues in the distant web site design or the way web metrics are calculated by the different web browsers. For instance, we identified that the current calculation of the PLT is not accurate for dynamic web pages and the use of massive asynchronous JavaScript nowadays implemented by web developers. Similarly, the implemented ATF (Above-The-Fold) calculations is not accurate since it does not take into account asynchronous JavaScript (e.g ryanair.com, blog.me, bing.com, etc.) fired after the PLT time elapses (after the onLoad event). Another limitation of the ATF is the use of external tools (e.g video recording).
Figure 4 shows measurements performed on the website forgeofempires.com, where the PLT calculation does not capture asynchronous JavaScript which further triggers the download of 197 resources, needed to correctly display the web page.

Figure 4 : forgeofempires.com website
Thanks to MORIS, we have also detected other inefficiencies in the actual web metrics calculation (see [1]).
Finally, all collected values are stored and monitored graphically through a website (Figure 5 shows the monitoring of youtube.com when using a fibre network access), which allows through time to better analyse the evolution of the different Internet protocols and collected timings at different times of the day.
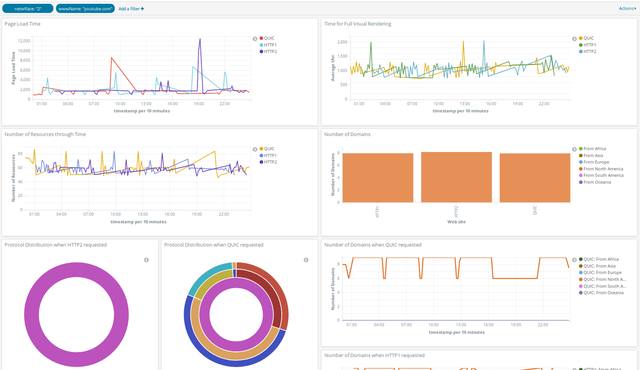
Figure 5 : MORIS Dashboard
Troubleshooting of degraded sessions - link with network topology
Via MORIS, when performing automated web browsing sessions, we also retrieve the IP addresses of the different content servers delivering the data from the browser’s network logs themselves (as per preferred protocol or using IPv4/IPv6). As an example, Figure 6 shows the map of all network equipment (e.g. routers) and servers involved in the delivery of the home page for the website youtube.com.
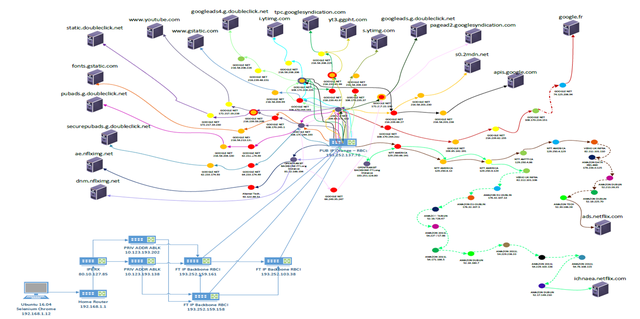
Figure 6 : Network complexity for youtube.com main web page
Being at a network operator (Orange), our objective is to be able to detect in case of a QoE degradation if this bottleneck is caused by the client’s browser, the client home network, the operator’s network, the intermediate networks (e.g. Tiers-1 or others Autonomous Systems) or the server side.
Future work
Knowledge of the network topology is mandatory and we will investigate information regarding link quality between these entities (delay, congestion issues, etc.) through the RIPE IPmap tool. We will dive into mapping networking information with our application level measurements to better identify bottlenecks. We welcome feedback on this project as we embark on these next steps. A Google-Chrome and Mozilla-Firefox plugin will be provided soon, reflecting the particularities of MORIS. Stay tuned!
This work was presented at RIPE 76 in Marseille, France during the MAT (Measuring and Tools)Working Group session. Please refer to the video and the slides for more information.
[1] A. Saverimoutou, B. Mathieu, S. Vaton, “Web Browsing Measurements: An Above-The-Fold Browser-Based Technique”, ICDCS 3rd Workshop on QoE-based Analysis and Management of Data Communication Networks, 2-5 July 2018, Vienna, Austria

Comments 1
The comments section is closed for articles published more than a year ago. If you'd like to inform us of any issues, please contact us.
Ross Alisha •
"Nice post. I learn something new and challenging on sites I stumbleupon every day. It’s always useful to read content from other writers and use something from other web sites."