
In this article we provide some analysis on the updates received by the RIPE Database during 2011 and in the first two months of 2012.
Introduction
We were asked to look at the number of updates received for RIPE Database objects and analyse how and where they come from. We separated the incoming updates into three categories:
- Email updates
- Syncupdates
- Other (internal processes)
For the purpose of this analysis we do not differentiate between Webupdates, Syncupdates or the RESTful API. At the back end, these all use the Syncupdates process and are grouped together in that category.
To determine where the updates were coming from, we chose to identify them in relation to MNTNER objects rather than by IP or email address. For each update message, we identified which MNTNER object(s) authorised the updates of the objects within that message. These were then grouped by the number of updates authorised by each MNTNER object found in each of the two categories.
For ease of reading we summarised the number of updates into ranges. The raw data is added at the end.
Two groups of data are provided covering 1 January - 20 February 2012 and the whole of 2011.
Summaries of data analysed
2012 RIPE Database updates (up to 20 February)
In the first section we show update statistics collected between 1 January and 20 February 2012.
In Table 1, you can see the number of updates received sorted by update method and update type. The total number of objects submitted between 1 January - 20 February 2012 was 2,675,721.
| Update methods: | Update types: | ||||
|---|---|---|---|---|---|
| sync | 600613 | RPSL object | 697888 | ||
| 111496 | help | 25 | |||
| other | 251 | spam | 14447 |
Table 1: Update methods and update types in 2012

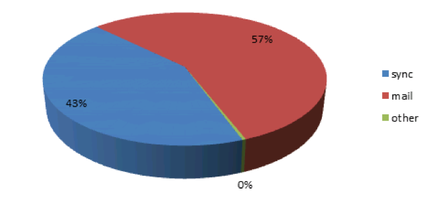
Figure 1: Update methods used between 1 January 2012 - 20 February 2012

Figure 2: Number of MNTNERs doing a set number of Sync updates in 2012
In Figure 2 the number of MNTNER objects are grouped by number of updates. For example, 79% of the MNTNER objects that authorised changes in sync update messages submitted between 1 and 10 sync updates to the RIPE Database in this period. Only 2% of the MNTNER objects submitted between 101 and 1,000 sync updates.

Figure 3: Number of MNTNERs doing a set number of Mail updates in 2012
In Figure 3 the number of MNTNER objects are grouped by number of updates. For example, 73% of the MNTNER objects that authorised changes in mail update messages submitted between 1 and 10 mail updates to the RIPE Database in this period. Only 1% of the MNTNER objects submitted between 1,001 and 10,000 mail updates.
Tables 2 and 3 show the actual numbers for how many (ranges of) updates are done by how many maintainers. The first one shows sync updates, and the second one shows mail updates.
| Nr. of Sync Updates | -->done by--> | Nr. of MNTNERs |
|---|---|---|
| 1-10 | 4821 | |
| 11-100 | 1172 | |
| 101-1000 | 104 | |
| 1001-10000 | 10 | |
| 10000+ | 6 |
Table 2: Number of Sync updates done by number of maintainers
| Nr. of Mail Updates | -->done by--> | Nr. of MNTNERs |
| 1-10 | 1252 | |
| 11-100 | 373 | |
| 101-1000 | 74 | |
| 1001-10000 | 15 | |
| 10000+ | 2 |
Table 3: Number of Mail updates done by number of maintainers
2011 RIPE Database updates
In the next section we show update statistics collected between 1 January and 31 December 2011. In Table 4, you can see the number of updates received sorted by update method and update type. The total number of objects submitted in 2011 was 5,033,598
| Update methods: | Update types: | ||||
| sync | 1389022 | RPSL object | 3083190 | ||
| 1834380 | help | 30639 | |||
| other | 11226 | spam | 120799 |
Table 4: Updates methods and update types seen in 2011

Figure 4: Update methods used in 2011

Figure 5: Number of MNTNERs doing a set number of Sync updates in 2011
In Figure 5 the number of MNTNER objects are grouped by number of updates. For example, 71% of the MNTNER objects that authorised changes in sync update messages submitted between 1 and 10 sync updates to the RIPE Database in this period. Only 3% of the MNTNER objects submitted between 101 and 1000 sync updates.

Figure 6: Number of MNTNERs doing a set number of Mail updates in 2011
In Figure 6 the number of MNTNER objects are grouped by number of updates. For example, 74% of the MNTNER objects that authorised changes in mail update messages submitted between 1 and 10 mail updates to the RIPE Database in this period. Only 19% of the MNTNER objects submitted between 11 and 100 mail updates.
Tables 5 and 6 show the actual numbers for how many (ranges of) updates are done by how many maintainers. The first one shows sync updates, and the second one shows mail updates.
| Nr. of Sync Updates | -->done by--> | Nr. of MNTNERs |
|---|---|---|
| 1-10 | 15333 | |
| 11-100 | 5634 | |
| 101-1000 | 658 | |
| 1001-10000 | 62 | |
| 10000+ | 10 |
Table 5: Number of sync updates done by number of maintainers in 2011
| Nr. of Mail Updates | -->done by--> | Nr. of MNTNERs |
| 1-10 | 4235 | |
| 11-100 | 1085 | |
| 101-1000 | 347 | |
| 1001-10000 | 56 | |
| 10000+ | 19 |
Table 6: Number of Mail updates done by number of maintainers in 2011
Raw data
The raw data for 2011 and 2012 is available on request. This data expands on Tables 2, 3, 5 and 6. So for example in Table 6 we see that 4,235 MNTNERs submitted 1-10 mail updates. The raw data includes the actual numbers, for example 1,680 MNTNERs submitted 1 update, 972 MNTNERs submitted 2 updates, etc. If you want this data please contact ripe-dbm@ripe.net .

Comments 2
The comments section is closed for articles published more than a year ago. If you'd like to inform us of any issues, please contact us.
Daniel Karrenberg •
Do I read this data correctly when I conclude that there has been a shift from mail towards the other update methods from 2011 to 2012? If so was that trend already visible in 2011? What do you think has caused this trend? I am also interested to know why there are a few maintainers doing so many updates. Are these what we used to call "NULL" updates, e.g. not changing anything in most updates they touch? And if they are changing anything for so many objects, what is it in general terms?
Denis Walker •
Dear Daniel Maybe one and a half months into 2012 is not enough of a data set to make too many judgments on annual stats. But looking at some monthly figures there has been a gradual shift from mail updates to sync updates. Having re-written the Webupdates and Syncupdates services and provided a RESTful API has certainly made these update methods more reliable and easy to use. Regarding your second question, since the beginning of this year one organisation has been submitting a series of updates on a daily basis. Each of these updates contains hundreds of INET6NUM objects that have not changed. So the count of 'No Operation' results from the update service massively increased in 2012. As a side note, we generated these particular stats in response to a specific question from the community to assist in the decision making process about the use of passwords in email updates.