
View maps based on RIPE Atlas traceroute measurements. Compare the maps to the ISP's description of their topology. See the potential of RIPE Atlas for mapping the packet layer topology. Learn about experimental tools you can use yourself to explore. Make suggestions for further work.
Introduction
I have been looking forward to become a RIPE Atlas power user myself all the time while I was busy leading its design and development. Now I have passed on the responsibility for building and maintaining the RIPE NCC measurement tools. So I am finally digging into the RIPE Atlas data. Let me take you along on an exploration of the RIPE Atlas mapping capabilities. For a first subject of study I chose the RIPE Atlas anchor in Vienna; it is conveniently located at the top of our anchor list. All raw data I collected for this study is publicly available. I will provide you with pointers on how to do similar explorations yourself. I will also tell you how you can access my personal lab tools to analyse the results of your own measurements.
A Local Map
Let us explore how this anchor is reached from Austria itself. The details about how to create a measurement can be found in the User Defined Measurements Documentation . There is also an API for doing this. Also look for a number of previous RIPE Labs articles on the subject of user defined measurements.
Figure 1 below shows a summary of a regular RIPE Atlas traceroute measurement from all probes in Austria that were available at the time (you can enlarge all the images by clicking on them):

We can see that the period during which the results have been taken is 2.5 minutes. If we wanted results more quickly, we could have scheduled a one-off measurement. We will explore the details of measurement scheduling in an upcoming article.
The Complete Map
Next we extract all the paths, the sequences of IP addresses returned by traceroute. The paths we obtain represent those Internet nodes that responded to the TTL of the outgoing packet expiring. If you would like a refresher, I suggest this pretty good slide pack on the subject by Richard Steenbergen presented at NANOG. Thus we trace the path the packets take from the probe towards the Vienna anchor. We omit hops with private (RFC1918) addresses. These hops typically appear at the beginning of traces that start behind NATs.
There were only 69 unique paths from 71 probes, some probes must be close enough together to have almost the same point of view. The full path table can be found in the raw data. A convenient way to extract it is the LARA tool I will describe below.
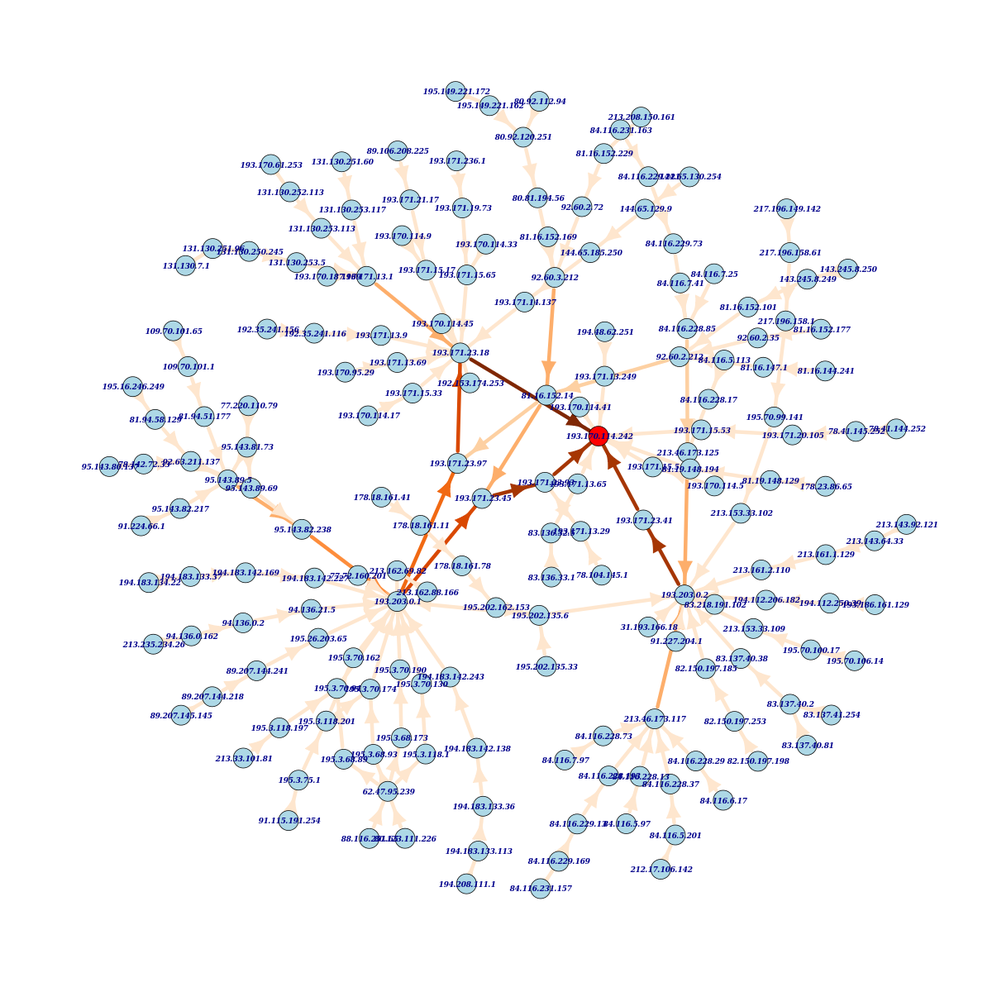
Of course mapping is about visualisation, so next we draw this picture of all the data:

I find this data exciting because it is packet-layer data. It measures which routers the outgoing packet actually traverses and not just what path the routing plane said they should take. In other words, we are looking at the forwarding plane here and not the routing plane.
This full picture of all data from our single measurement may be impressive, but it is hard to analyse. There are simply too many edges in the graph. However, we can see immediately that the Vienna anchor, marked red, has more than one packet-layer neighbour. The darker an edge appears on the map, the more paths it carries. As we would expect some edges close to the target carry a large number of paths and there are nodes in the topology that 'concentrate' paths. Af few nodes have more than one outgoing edge; this indicates that some paths leave the node in one direction while others take another turn.
Drilling Down
Let's now drill down and look at the packet-layer close to the anchor. We will start from the anchor and work outward from there. The remaining graphs show only those edges that carry at least 5% of the paths. This prevents clutter and helps us to concentrate on the parts of the packet-layer that are most significant for the connectivity of the anchor.

The graph in Figure 3 above shows only edges directly connected to the anchor. This time we have labeled the nodes with their reverse DNS names. The anchor has three packet-layer neighbours. The names of the neighbors suggest that they are VLAN interfaces on the same switch.

In Figure 4 we have drawn all the paths that are up to 3 hops from the RIPE Atlas anchor. This gets more interesting. Austrian paths indeed reach the anchor from three general directions. Two interfaces, vlan75.wien3.aco.net and tengigabitethernet1-3.wien1.aco.net , each carry a part of the paths coming from the extreme right. This indicates that the packet-level has some redundancy to the right of the anchor. We also notice that ACONET seems to name their interfaces and routers in a consistent and hierarchical manner. We can probably draw this picture at the router level by dropping the leftmost label of the name (see Figure 5 below).

The anchor is connected to ACONET switch wien21 . wien21 in turn is connected to wien1 and wien3 , and these two are connected to core1 . Another connection with a lot of paths is from core21 to wien21 .
Here is what ACONET publishes about their physical and packet-layer topology in Vienna:

We can certainly recognise this picture from our exploration. We can also see that the link between core1 and core21 is not used by the packets in this measurement.
Follow the Address Space
Another way to aggregate the path information is by grouping paths by the address space that is used to number the interfaces. We use the netname attribute of registration records to do this. The same data we used in Figure 5 (3 hops out from the anchor), now looks like this:

Looking at it this way, the bulk of the paths in the measurement pass interfaces that are numbered from a Vienna Internet Exchange (VIX) address block. Without further analysis I assume that core21 has such an interface and that core1 may very well also have one.
Zooming out to 7 hops reveals that AT-TELEKABEL is "hiding behind" an NL-CHELLO numbered interfaces and that AT-CNH reaches our anchor via DE-CIX numbered ones:

We will leave it for another time to find out whether the DE-CIX numbered interfaces are actually in Frankfurt.
Reproducible Research
I aim to make my research reproducible by providing access to all raw data and the tools I use.
Raw Data
The complete raw data used in this article can be accessed at
https://atlas.ripe.net/api/v1/measurement/<msmid>/result
where msmid is:
- 1040198 one-off measurement from probes in Austria
- 1039483 regular measurement from probes in Austria
There are other measurements I ran and looked at during the preparation of this article
- 1036968 measurement from probes in Germany
- 1036966 measurement from all RIPE Atlas probes
- 1039480 earlier one-off measurement from probes in Austria
The structure of this data is described in the RIPE Atlas - Raw data structure documentation .
Tools
The tools used for this work can currently be accessed at http://labske.org/tools
They tools are written in R http://www.r-project.org/ . Source code is available on request.
What's next?
I am currently deciding which of the research questions listed below to work on next. Most likely I will look at RTTs. That way I will provide some additional tools to describe traceroute measurements, that others may find useful.
I will also publish short articles about analysis of already collected traceroute data in RIPE Atlas. A particular area of interest will be topology changes. There are going to be more "RIPE Atlas Fun:" articles.
If there is interest I could write a 'Making of' article describing the tools and the process of creating them.
I am also working on format and tools for a "RIPE Atlas Quarterly Report" that will regularly describe the current state of RIPE Atlas and that can be used as a reference article.
If you have any other interesting "Chief Scientist" type questions, do not hesitate to get in touch.
Conclusions
It is possible to explore the connectivity of any Internet host in a quite intuitive way using the results of RIPE Atlas measurements. In our example the result of the exploration matches the published packet-layer topology. The RIPE Atlas data holds a lot of promise for future explorations and tools.
Closing Notes
Limitations
The power of this method is limited by the number of vantage points. It can miss a large number of possible paths because it misses vantage points from which they would be used. The closer one gets to the target, the higher the likelihood to discover a path.
The method uses adjacencies and not full paths. This means that there is a slight possibility that a "path" is being suggested by the graph that is not really traversed.
Further Work
The large scale traceroute measurements will help to answer a lot of questions. Some of these are listed below. The list contains all sizes of scope and complexity. If you are interested to collaborate on any of these questions or related ones, please get in touch with me. If you are using RIPE Atlas results for independent work please be so kind and let us know; maybe we can be of help or bring together people working in the same area.
Paths
Develop descriptive statistics for the paths in a traceroute measurement: Can we attach a value of topological goodness to a map? Can we characterise certain types of topologies?
RTTs
This work does not even look at the RTT values collected by the measurements. We could look at descriptive statistics of RTTs for the whole measurement. Investigating variations in RTTs to the final few hops might be useful? What is a good filtering strategy for noise and spikes introduced by ICMP rate limiting and/or router CPU congestion?
Time line
One could develop statistics about the differences between successive traceroute measurements. Can we detect and characterise significant topology changes? Can we trigger useful network management alarms? Can we predict future behavior and trouble?
Measurement Design
Can we find the minimal measurement configuration necessary to map a certain region of the Internet? Can we find a measurement configuration that monitors a certain target host or network effectively? ... for the purpose of raising alarms? ... for the purpose of predicting future behavior and trouble?
Adaptive Measurements
How to configure future measurements based on the results of past measurements in real time. Can we 'zoom in' on anomalies we detect? Also consider other inputs such as routing measurements, see Hubble .
Reverse Paths
Design measurement configurations that measure both directions of a full or partial path. This should not be too difficult if one side is an anchor; these can do a lot of measurements. How symmetric are the paths? Does it matter? What can we say about the reverse path from the forward measurement alone?
Large Scale Maps
Can we combine all the measurements taken by RIPE Atlas into a map of a certain region of the Internet? What descriptive power does such a map have? What predictive power? What extra measurements are needed to increase the power of such a map? Can we construct a prioritised list of such additional measurements and does it really help to run them?
Packet Layer vs Routing Layer
How do the packet paths we find relate to routing? In BGP? In IGPs?
Packet Layer & Routing Layer
Can we combine measurements about control and data plane for more descriptive and predictive power?
Packet Layer & Physical Layer
What descriptive power do our packet layer results have about the physical infrastructure?
Trivia
Why "RIPE Atlas Fun:"? Isn't this serious business?
Yes it is. However, I firmly believe in having fun when doing serious stuff. Some of you may know that I used to close the early "Quarterly Reports" of the RIPE NCC with words like "It is still fun!". At the moment I am having a lot of fun while I see the power behind RIPE Atlas first-hand and while I discover little bits about the Internet that I had not known before. I hope these articles will be useful to you, but fun too.
Acknowledgements
I thank the RIPE NCC membership and the RIPE Atlas sponsors who provide funding for this great tool.
In particular I thank all people who have contributed to building RIPE Atlas. Of course in the first instance those who have designed and developed it, but definitely also many of you who have provided comments and ideas.
Thanks also to the ACOnet folk and RIPE NCC colleagues for comments and suggestions.

Comments 1
The comments section is closed for articles published more than a year ago. If you'd like to inform us of any issues, please contact us.
Rajesh Purkait •
I am a research scholar in India.And i am working on that particular field .My mail id is rajesh.purkait86@gmail.com. I like to attach with your work .So give your contact details .