
RIPE Atlas can now test packet flows from more than 1000 vantage points on the Internet. We took a quick look at anycast traffic to DNS root name servers. There is a lot of interesting signal in this data.
As a follow-up to DNS Measurements with RIPE Atlas Data , we now looked at the frequency with which Atlas probes change from one anycast instance of a DNS root name server to another. The servers answer a special query with an ID string which encodes the location of the server instance responding to the query. This way it is possible to detect when such a query gets answered from a different instance than the previous query.
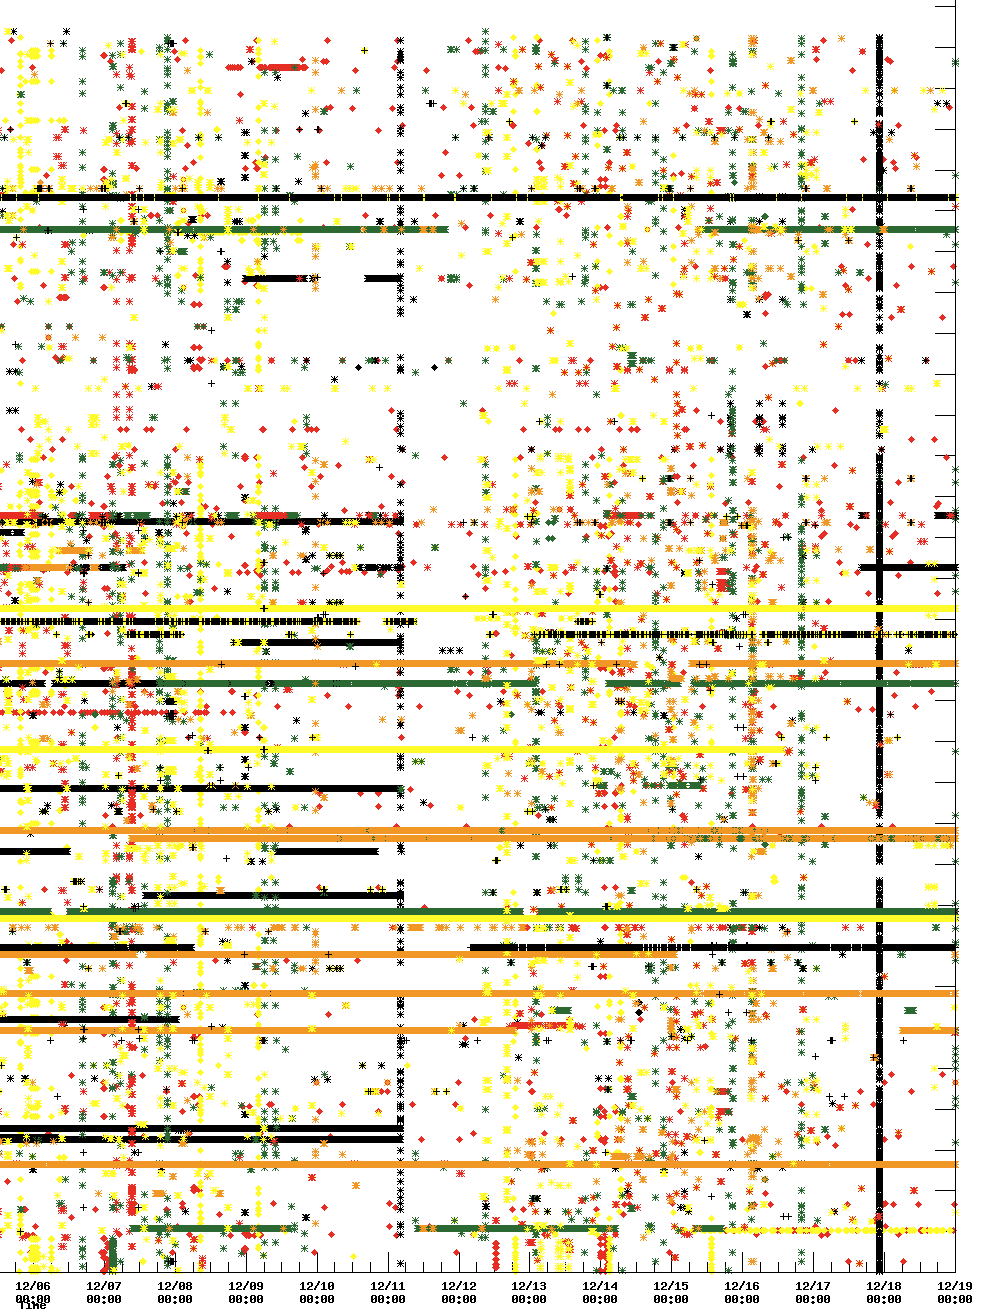
The graph below shows the points in time when this happens. The x-axis is time and the y-axis shows all probe IDs. A mark is put on the plot each time the location serving the particular probe changed. The colours represent the root name servers, see the legend in the upper right corner. We do not show switches between instances at the same network location; this means that the switches that are shown in this graph are very likely caused by changes in Internet routing. If you click on the image twice, it enlarges to a high resolution. A very high resolution version is available for the purpose of zooming into specific events.

Notes:
- The gap in RIPE Atlas probe IDs between 1,500 and 2,000 is intentional: all version 2 probes received IDs from 2,000 onwards and there are only slightly more than 1,500 version 1 probes.
- White space in the graph does not mean that there were no instance switches. It just means we did not observe any. Not all probes are operational and some probes did not take measurements during the whole time covered by this graph.
- We ignore instance switches if measurements were taken more than 15 minutes apart. This is to avoid noting switches too late if we miss some measurements.
-
Probes with low IDs show very similar patterns:
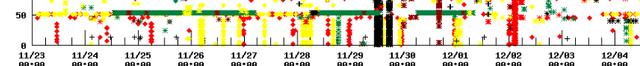
Figure 2: RIPE Atlas probes with low IDs
This is due to the fact that our initial deployment was limited to the Netherlands with a heavy bias in the Amsterdam area. While they are certainly not all in one autonomous system, they apparently show strong commonalities in this data.

Immediate observations

Figure 3: RIPE Atlas probes switching constantly between all root name servers
These probes are apparently subject to DNS spoofing. It is not the root name server that answers their queries but some middle box, most probably inserted by their ISP. The server IDs returned to these probes are not those of any DNS root name server.
There are a number of probes that show strong horizontal lines for one or just a few letters:

This means they switch instances for one or more letters much more frequently than most other probes. This warrants some research of the routing at these locations. We suspect that some form of "inter-domain load balancing" may be responsible for this effect.

However, the most interesting are the vertical patterns that are either not consistent for all probes or that involve a number of different letters. These patterns are indications that packet flows changed significantly in a limited area. Identifying the causes of this is an interesting challenge. These changes may very well be a powerful trigger that indicate instabilities in the Internet data plane that need investigation. A good example is the line at about 0400 on December 16. In the high resolution graph one can clearly see that these are two different events involving mostly K and L with a sprinkling of others.
Conclusion
There is a lot of signal in the data RIPE Atlas has about anycast instance changes. This data is obviously useful for the operators of anycast servers as a diagnostic and monitoring tool. Since these measurements can detect changes in packet flow with very little traffic we can measure frequently and to a large number of targets. So this data has a lot of potential to detect and analyse changes in packet flows in the network itself. If you are interested in the raw data, please contact the author.
With this seasonal gift from RIPE Atlas we wish you a merry holiday season and a happy new year.


Comments 0
The comments section is closed for articles published more than a year ago. If you'd like to inform us of any issues, please contact us.