
The Internet has a robust infrastructure that was designed to route around damage. But how well does it do this? We use RIPE Atlas to look at how large-scale disruptions in the Internet's core infrastructure affect end-to-end connectivity on the Internet.
On 13 May 2015, AMS-IX (a very large Internet exchange point) experienced a partial outage, and on 12 June 2015, there was a big route leak affecting Level 3 (a very large transit provider). More information about the latter event can be found in initial analyses by BGPMon and Dyn .
So if the Internet routes around damage, why were these two events noteworthy? Can we gain more insight into how events like these affect connectivity between hosts on the Internet?
While we have neither the ability nor the desire to monitor all Internet traffic (we leave that to the specialists in government agencies), we do have a widely-deployed network measurement infrastructure that may give us insight into the effects of large-scale outages: RIPE Atlas .
Earlier we've shown how RIPE Atlas sees large outages at the edge of the network, for instance due to a problem in the edge content network , or due to a massive power failure . But since RIPE Atlas measurements also traverse IXPs and transit networks, we should be able to show the extent of issues when something goes wrong in the core of the network.
The Internet is very interconnected, so if something bad happens in a network, other networks typically have alternative paths to reach all the other networks. That's how the Internet was designed. Or to take an airline analogy: If one airline runs out of fuel, passengers can take other airlines to reach their destination. Or if an airport is closed due to bad weather, passengers are redirected to other airports.
The Internet uses BGP as its control plane protocol, which is quite good at signalling when a network completely drops off of the Internet, but it doesn't signal other "bad Internet weather", like massive delays, or packets dropping.
So if there is "bad weather" in a neighbouring network, packets can be redirected along alternate routes if these are available, either automatically or manually through the intervention of network operators. Otherwise packets will fly into these storms and may not arrive at their intended destination.
To look into this, I first wanted to know how many reliable paths there are across an infrastructure that we have. By reliable, I mean the path is:
- Via the infrastructure we monitor
- Has an end-point reliably responding
- We have enough measurements on the path
For more details about the methodology, please see footnote .
Table 1 below shows how many of these paths we have for a "normal" day. In this case I took the days before the events we want to look at.
| Infrastructure | Date |
Sources (RIPE Atlas probes) |
Destinations (IP addresses) |
Source-Destination pairs (Internet paths) |
| AMS-IX | 2015-05-12 | 3,289 | 753 | 14,431 |
| Level 3 (AS3556) IPv4 | 2015-06-11 | 7,211 | 488 | 16,731 |
| Level 3 (AS3556) IPv6 | 2015-06-11 | 885 | 279 | 3,287 |
| Level 3 (AS3549) IPv4 | 2015-06-11 | 438 | 195 | 1049 |
| Level 3 (AS3549) IPv6 | 2015-06-11 | 99 | 145 | 319 |
| Malaysia Telekom (AS4788) IPv4 | 2015-06-11 | 15 | 51 | 137 |
| Malaysia Telekom (AS4788) IPv6 | 2015-06-11 | 6 | 26 | 43 |
Table 1: Number of 100%-success-across-infrastructure end-points
As you can see, we have enough data to look at AMS-IX and Level 3, but the number of measurements across Malaysia Telekom is quite low, so I won't show these in the results section. Now that we have sets of paths that have good connectivity through various infrastructures in a reliable way, we can see what happens to these paths in "bad weather".
Case Study: AMS-IX on 13 May 2015
The information we received from AMS-IX is that the primary cause of the event lasted for seven minutes and two seconds, from 2015-05-13T12:22:12+02:00 to 2015-05-13T12:29:14+02:00. This was the interval from a switch interface starting to generate looped traffic until the backbone interface of the switch was shut down, which immediately stopped the disruptive traffic from being propagated.

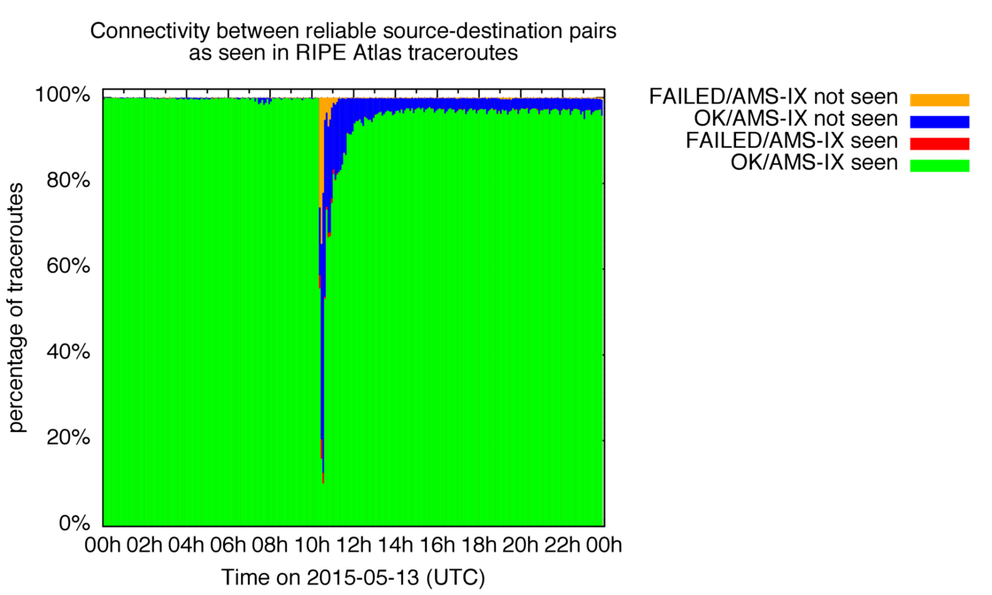
Figure 1: AMS-IX outage
Figure 1 shows how our test set of 14,431 source-destination pairs saw AMS-IX on 13 May 2015, the day the AMS-IX peering-LAN had a partial outage.
For every five-minute interval during this day, we show what percentage of measurements between these pairs was in each one of the following categories:
- Connectivity is OK, and AMS-IX infrastructure was seen (green). This is the base state, and because we selected our source-destination pairs for this, this should be the dominant category under normal circumstances.
- Connectivity is OK, but AMS-IX infrastructure was not seen (blue). You'd see this if the path between end-points changed, so it would not traverse AMS-IX infrastructure anymore. Alternatively, you'd see this if the path between end-points would still traverse AMS-IX infrastructure, but the infrastructure would stop returning ICMP messages, so it would be invisible in traceroutes. Because we selected source-destination pairs to reliably see the AMS-IX infrastructure in traceroutes, the expectation is that this case is relatively rare, and if it happens, it probably indicates some problem with the infrastructure.
- Connectivity is not OK (yellow and red). The difference in coloring indicates if the AMS-IX peering-LAN was not seen (yellow) or if it was seen (red). Both cases indicate a failure in end-to-end connectivity. Because we only show data for otherwise very reliable end-to-end connectivity, this is a good indication of actual problems going on. And if we have a large variety in both sources and destination, individual failures of end-points will not affect this much. In these case where we still see the AMS-IX peering-LAN (red).
The color coding I use here is suggestive, but indicative of how you could think about this from the perspective of the infrastructure operator. The green fraction of paths is the normal/steady-state, but the yellow and red fractions are bad; and if there is a lot of red you know your infrastructure could very well be involved in whatever event takes place, and is negatively impacting end-to-end connectivity. The blue fraction are paths with usable end-to-end connectivity, but they are now routed somewhere else. That's interesting to look into, but not impacting end-to-end connectivity through your infrastructure.
What's interesting is that during the worst 5 minute interval for this event, 10% of OK connectivity through AMS-IX remained (green), while we detected about 30% of failed connectivity (yellow and red), and 60% of paths switched away from AMS-IX (blue). This blue fraction is indicative of the routing-around-damage property of the Internet at work, while the failed connectivity fraction (yellow and red) indicate failures to routing-around-damage.
Note there is some periodicity in the signal over time. This is because data is binned per five minute interval, while some of the large measurements have 15 to 30 minute intervals. So this is an artifact of how this is measured and analysed, that also provide a sense of the margin of error of the overall effects that we measure.
It is also interesting to note that by the end of the day there are in the order of 5% of paths where we still don't see the AMS-IX peering LAN in the path. This could be due to network operators keeping their peerings at AMS-IX down, or it could be the BGP path-selection process at work: If all of the other BGP metrics (local pref, AS path length etc.) are equal, the oldest path (or currently active path) is selected. So if the AMS-IX peering session was down for a while, and another path with similar BGP metrics was available, then the BGP path selection process would select this other path.
Case study: Level 3 on 12 June 2015
Level 3 operates several Autonomous Systems (ASes), the primary ones are AS3356 and AS3549 (the former Global Crossing network). As can be seen in Table 1, we do have plenty of paths consistently traversing AS3356 in IPv4 traceroutes, but AS3549 has far less paths that we measure.
In Figure 2 and 3 we show the effect of the issues in Level 3 on 12 June for RIPE Atlas IPv4 paths reliably traversing AS3356 and AS3549. As you can see in Figure 2, the AS3356 paths we measure seem less affected than the AS3549 paths. At the peak of the event, we see that in about 30% of paths that used to include AS3549 we don't see AS3549 anymore, but they also don't end up reaching the intended destination anymore.
At the end of the day we still see a residual set of paths that seem to have moved away from using Level 3. This is about 5% of paths for AS3356 and 10% of paths for AS3549.

Figure 2: Connectivity through Level 3 (AS3356) during route leak

Figure 3: Connectivity through Level 3 (AS3549, previously Global Crossing) during route leak
Conclusion
We prototyped a method for RIPE Atlas to measure the effects of large scale events on the Internet that can be used on infrastructures that are not at the edge of the network. This is still a little rough, but shows how RIPE Atlas sees the effect of large scale outages in the core from the perspective of connectivity between end-points. We see both the avoidance of infrastructure under duress and end-to-end connectivity failure.
Are these RIPE Atlas measurements representative for all of the Internet? If we look at all potential end-to-end connections on the IPv4 Internet, this is already in the order of quintillion s (10^9*10^9 = 10^18), so it's hard to say with any certainty. What we do know is that we have good diversity in measurements for the infrastructures we used as examples here. The more that people create measurements between end-points they are interested in, the more RIPE Atlas measurements will reflect the parts of the Internet that people care about the most.
We are really interested in ideas on how to improve this. Your ideas, as always, are very welcome in the comments section below.
We are also looking for networks and IXPs that would be interested in having this type of monitoring applied to their infrastructure. This would allow you to detect if normally good end-to-end connectivity through your infrastructure starts failing, or when it starts to be routed around your infrastructure.
Interested? Email us at labs [at] ripe [dot] net.
Footnote 1: Methodology
To filter RIPE Atlas data for the most reliable signal, we select pairs of end-points (RIPE Atlas probes towards individual IP addresses) with traceroutes that have a 100% success rate in both:
- Reaching the destination (i.e. at least one out of three packets to the destination in a traceroute got a response); and
- Having the infrastructure (IXP or transit network) we want to study visible in traceroute. This is done by matching against a list of known prefixes for the infrastructure. For an IXP this is the IXP Peering LAN, for the transit networks I used the list of prefixes where the transit network is the last AS in the path, as seen in RIPE RIS. This has known limitations, but in bulk will reflect paths across this transit network.
We also need a minimum number of measurements to assess this 100% success rate, so we only use pairs where we have at least 48 measurements (one every 30 minutes). We run this calibration for a full day, and then look at the results between the selected end-points on the next day. If the infrastructure is traversed well enough (i.e. we have enough paths across it) individual failure of a source or destination will not significantly affect the big picture.
Comments 1
The comments section is closed for articles published more than a year ago. If you'd like to inform us of any issues, please contact us.
Stéphane Bortzmeyer •
Fascinated that there are so many traceroute measurements going on that you can find enough to study, after the facts, an outage :-)