
In this article we look at some of the effects Hurricane Sandy had on the Internet data plane, as we can see them in traceroutes done by RIPE Atlas.
Introduction
Hurricane Sandy caused major damage in both the Caribbean and the North-Eastern part of the USA. In an earlier article RIPE Atlas - Superstorm Sandy we showed data on 15 RIPE Atlas probes that are located in or near the affected areas in the USA. Most of these locations are now back to what look to be normal round trip times to targets we monitor.
But the effects of Hurricane Sandy were felt on the Internet beyond the immediately affected area. The affected area also happens to contain major hubs for international Internet connectivity. When looking at cable maps (for instance Greg's Cable Map ), it immediately becomes clear the affected area is key for Internet communications between North America and Europe.
Two major hubs for international Internet communications in the affected area are the New York City (NYC) and Washington DC/Ashburn area (ASH). In this article we look at IPv4 traceroutes by RIPE Atlas probes that traverse paths through the affected area and what they could tell us about the impact that Hurricane Sandy had on the wider Internet.
Method
Due to lack of a geolocation solution that works accurately enough for router infrastructure, I resorted to a more crude method to see what traceroutes went through the NYC and ASH areas. For traceroute output we can often easily determine the location of the equipment by looking at the hostname. Network operators are usually pretty methodical about naming their equipment and including geographic information. Following this approach I flagged IPv4 traceroute paths going through the NYC and ASH area, and looked at how Sandy affected the number of paths for a number of destinations. See footnote [1] for the exact string matching expression used to determine if a trace went through NYC or ASH. Some manual correction of these results was done (for instance the NYC airport code ' lga ' also matches ' Bulgaria '). This method does not completely identify all paths through the areas we look at, nor is it completely accurate, but it gives a good impression on how things changed in the days before and after Sandy. I used IPv4 instead of IPv6 because IPv4 currently provides the most vantage points. If people are interested, we could repeat this analysis for IPv6 too.

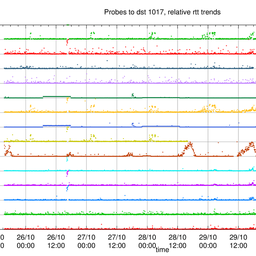
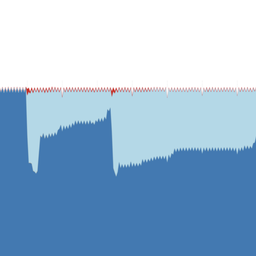
Figure 1: The number of RIPE Atlas traceroutes towards ns.ripe.net/AS3333/Amsterdam,NL over time. Total number of paths measured every 30 minutes is shown in green. The number of paths determined to go through the NYC and ASH areas are shown in red and blue respectively.
Figure 1 shows the number of paths we identified going through NYC (red) and ASH (blue) for traceroute4 measurements from all RIPE Atlas probes towards ns.ripe.net around the time Sandy hit the US East Coast of the US. Because ns.ripe.net is located in Amsterdam, the Netherlands, RIPE Atlas probes on the American continent need to cross the Atlantic for the shortest path towards this destination. The time Sandy made landfall (midnight 2012-10-30 UTC) is marked with an orange line. Each dot on this graph is the aggregate of all traceroutes in a 30 minute interval. The small sub-graph at the bottom of Figure 1 (green) shows the total number of traceroute measurements that RIPE Atlas probes did to this target (ns.ripe.net). You can see from the total number of traceroute measurements that Sandy didn't have a big impact on the total number of RIPE Atlas probes being up or down. The paths identified as going through NYC dramatically drop about an hour before Sandy made landfall, and again drop a few hours later. At the same time as the number of paths through NYC drops, the number of paths identified as going through the ASH area increases significantly. Figure 2 shows a similar NYC to ASH shift for a destination in Germany.


Figure 3: The number of RIPE Atlas traceroutes towards d.root-servers.net/AS27/Univ Maryland,MD,US over time. Total number of paths measured every 30 mins is shown in green. The number of paths determined to go through the NYC and ASH areas are shown in red and blue respectively.

Figure 4: The number of RIPE Atlas traceroutes towards h.root-servers.net/AS13/Aberdeen,MD,US over time. Total number of paths measured every 30 minutes is shown in green. The number of paths determined to go through the NYC and ASH areas are shown in red and blue respectively.
Figure 3 and Figure 4 show measurements towards targets on the US East Coast (the DNS root servers D-root and H-root). Since the RIPE Atlas deployment is concentrated in the RIPE NCC service region (Europe, Middle East and former Soviet Union countries) a majority of traffic from RIPE Atlas probes needs to cross the Atlantic to get to these 2 destinations. About 1,600 out of 1,950 already went through the ASH area before Sandy hit and this didn't change much (if at all) in the hours after Sandy hit. This is not very surprising, because these 2 root servers are geographically not far from the ASH area. At the same time, the number of paths through New York to both D-root and H-root did drop significantly.

Figure 5: The number of RIPE Atlas traceroutes towards carson.atlas.ripe.net/AS7296/Los Angeles,CA,US over time. Total number of paths measured every 30 minutes is shown in green. The number of paths determined to go through the NYC and ASH areas are shown in red and blue respectively.
Figure 5 shows measurements towards a target on the US West Coast. As can be seen from this example, the paths that traffic takes towards this US West Coast destination were also affected by Sandy hitting the US North East Coast, and traffic diverted away from the New York area. The drop of paths through ASH around 3:30AM on 2012-10-30 is due to a single hop intra-AS path change. Before 3:30AM this hop contains the ' ash ' string, after 3:30AM the hop changes to a hostname containing ' unknown ', but this hop has very similar characteristics (same /24, similar RTTs). This shows that with better router geolocation this type of analysis can become more accurate.
Maps
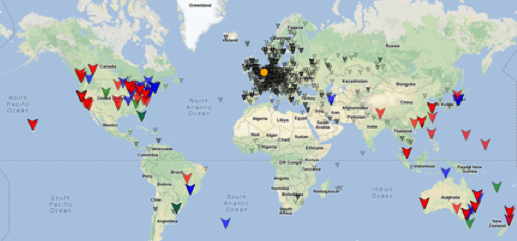
The graphs above show the extent of path changes in traceroutes towards 5 destinations. But path changes happen on the Internet all the time, so next I wanted to see the geographical extent of Sandy-correlated path changes from the NYC area to the ASH area. To accomplish this I put markers on a world map for each RIPE Atlas probe location and coloured them differently if the NYC area was in the path to a certain destination, both before and after Sandy hit the US. From the graphs above I determined representative times for both (before Sandy hit: 2012-10-29 22:00 UTC and after Sandy hit: 2012-10-30 09:00 UTC respectively). Markers are coloured as follows:
- Grey if NYC was not in the path before and after Sandy hit
- Blue if NYC was in the path before and after Sandy hit
- Red if NYC was in the path before, but not after Sandy hit
- Green if NYC was not in the path before, but was in the path after Sandy hit
An orange circle on the map represents the geographic location of the traceroute destination.
Figures 6 through 10 show screenshots of these world maps, based on the same traceroute data that figures 1 through 5 were based on. The interactive versions of these maps are also available by clicking on Figures 6 through 10, but beware these maps are prototype quality (tested in Chrome, Firefox, Safari, but can consume significant browser resources).
Figure 6 and Figure 7 show that for the 2 destinations in the Netherlands and Germany that we monitored, the paths that were diverted away from NYC were mainly in North America, Oceania and South-East Asia. The difference between Figure 6 and 7 is also interesting. In Figure 7 paths from North America are seen to mostly remain going through NYC, while in Figure 6 they seem to switch away more. This shows that what happened with regards to paths through NYC during Sandy is very destination dependent. Because a destination network determines who it's upstream networks are, this is hardly surprising. If you click on a marker in the interactive version of the map, you can see round trip times (RTT) and before and after traceroutes for this particular probe towards the destination that is visualised. From this you can get a feeling on how performance towards this destination was affected. Quite often there is an increase in RTTs seen for the probes with path-changes, but sometimes no such effect can be seen, or even situations with a decrease in RTT correlated with Sandy can be found! Please keep in mind that traceroutes only show the forward path, while RTT measurements measure both the forward path and the reverse path, these can be (dramatically) different.


Figure 7: Path changes in and out of the NYC area seen in traceroutes to ronin.atlas.ripe.net/AS24940/Falkenstein,DE. Interactive version of this map: http://sg-pub.ripe.net/demo-area/sandy-2012/maps/5017.2012-10-29T22:00.2012-10-30T09:00.nyc.html
Figures 8 and 9 show that for the 2 destinations on the US East Coast that we monitored, a lot of probes in Europe, and also Africa, had paths through NYC, and a large fraction (red) indeed moved away from NYC, correlated with Sandy landfall.

Figure 8: Path changes in and out of the NYC area seen in traceroutes to d.root-servers.net/AS27/Univ Maryland,MD,US . Interactive version of this map: http://sg-pub.ripe.net/demo-area/sandy-2012/maps/5012.2012-10-29T22:00.2012-10-30T09:00.nyc.html

Figure 9: Path changes in and out of the NYC area seen in traceroutes to h.root-servers.net/AS13/Aberdeen,MD,US . Interactive vrsion of this map: http://sg-pub.ripe.net/demo-area/sandy-2012/maps/5015.2012-10-29T22:00.2012-10-30T09:00.nyc.html
Finally, our destination on the US West Coast (Figure 10) also saw a lot of paths from Europe and African Atlas probes move away from NYC.

Figure 10: Path changes in and out of the NYC area seen in traceroutes to carson.atlas.ripe.net/AS7296/Los Angeles,CA,US . Interactive version of this map: http://sg-pub.ripe.net/demo-area/sandy-2012/maps/5020.2012-10-29T22:00.2012-10-30T09:00.nyc.html
Network operators who want to see how their networks were affected can filter by AS on the interactive maps. If there are other things you'd like to see in maps like these, we really want to know.
The average RTT increase we saw both for the paths that kept going through NYC and the paths that moved away from NYC were in the order of 10 to 20 ms (graphs not shown, this article is long enough already :) ). I'm not sure if this extra delay in information transfers was really noticeable for users accessing transatlantic content.
Conclusion
What is shown in this article are examples of how "the Internet routes around damage". It is telling that even with a major connectivity node under "attack", the Internet kept going, and the network operators who made this happen deserve a lot of credit for the work they put into planning their networks and keeping them operational and interconnected under difficult circumstances.
What is also striking about this particular situation is the geographic extent of end-points that saw paths move away from the New York City area. For the five destinations that we examined, we saw paths stop traversing the NYC area for a significant number of sources as far away as South-East Asia and Africa, even for destinations that were not close to the area affected by Hurricane Sandy.
The method I used (scan hostnames for location-identifying strings) to find paths that go through specific areas was unrefined, but already shows interesting things about path changes. With better router geolocation we could make this better. The standard well-known geolocation databases (MaxMind is the most prominent one) do reasonably well on resources located at the edge, but are not very well suited to pin-point location changes in traceroute paths. A number of projects exist that try to help solve this problem (undns, sarangworld, ixmaps.ca), though these are at various stages of maturity, or don't provide full coverage of the router infrastructure.
If people have suggestions on (preferably mature) solutions for better router geolocation, please comment below. Also we'd like to hear if interactive maps like we presented above are useful to you, and how to make them more useful.
Footnotes:
[1] New York Area hostname matching regular expression: /nyc|nyk|newyork|jfk|lga/i . Ashburn/DC Area hostname matching regular expression: /ash|abn|ashburn|dca|iad|washington/i
Comments 0
The comments section is closed for articles published more than a year ago. If you'd like to inform us of any issues, please contact us.