
After causing lots of damage in the Caribbean, superstorm Sandy is having a devastating effect on the US East Coast. We looked at the RIPE Atlas network to find out what effects this superstorm has on the Internet. Below are some preliminary results of what we saw.
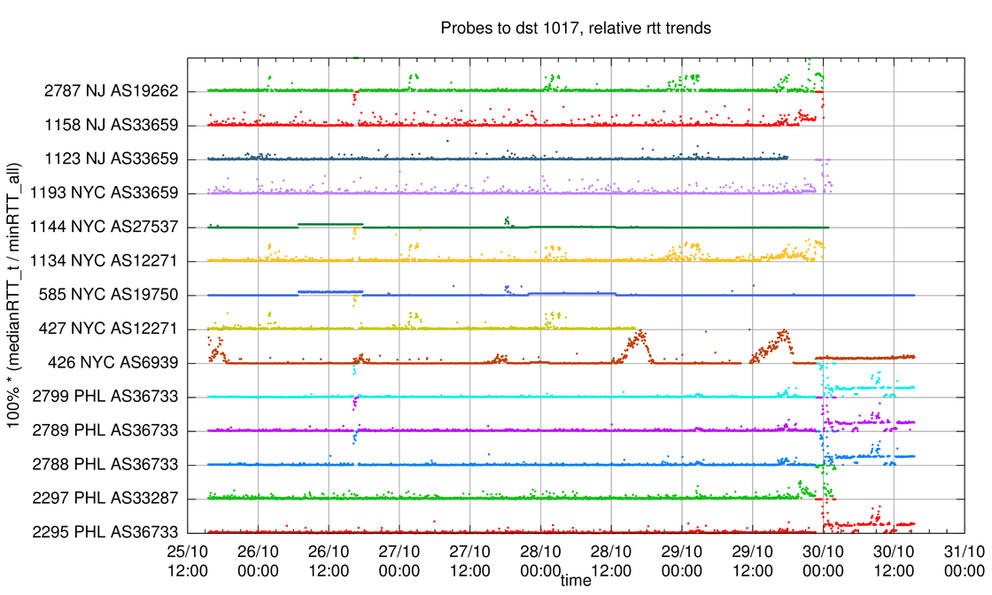
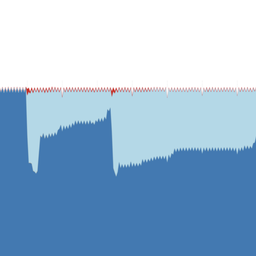
The RIPE Atlas network has a couple of fixed destinations that all RIPE Atlas probes measure towards. Measurement results of 14 probes located at the US East Coast to two of these fixed destinations are shown below. Figure 1 shows measurements to a destination in Germany. Figure 2 shows measurements to a destination on the US West Coast. You can enlarge these images by clicking on them.
The labels on the y-axes of the plot are: RIPE Atlas probe ID/location/ASN. Locations are:
- NJ: New Jersey
- NYC: New York City
- PHL: Philadelphia (city)
As you can see in Figure 1, we stopped receiving data from all probes located in New Jersey, and a majority of the probes in New York City on 30 October around midnight UTC. It is very likely that we stopped receiving data because of the power outages caused by Sandy. Most of the probes in Philadelphia stayed up, but had increases in Round Trip Times (RTTs) to the destination in Germany.

In Figure 2 we see the same set of probes to a destination to the US West Coast. We see less variation in RTTs
there
,
although all the Philadelphia probes that were up had an elevated RTT to this destination for a couple of hours. These probes are all in the same AS.

Figure 2: RTTs from selected US East Coast RIPE Atlas probes to a destination in Los Angeles. RTTs are plotted relative to the minimum RTT found during the plotted time period, and capped at 2x this minimum RTT. Times are UTC.
We set up a web page that shows periodically updated graphs of the measurements above. We will keep an eye on the measurements and report here on RIPE Labs if we find anything interesting.
Comments 2
The comments section is closed for articles published more than a year ago. If you'd like to inform us of any issues, please contact us.
Geoff Huston •
We are also seeing a hit on the number of announced ASes and announced prefixes that appears to be tightly aligned to the landfall of this storm. This storm appears to have taken out 400 Autonomous Systems (http://labs.apnic.net/bgp-30-10-12/ases.png) and 2,000 IPv4 prefixes (http://labs.apnic.net/bgp-30-10-12/prefixes.png. In IPv6 we saw some 20 ASes and 40 IPv6 prefixes that have been withdrawn in this period.
Jason Livingood •
I see my probe @ home in Philadelphia dropped when my home lost power. Interesting to see the effects overall as the network in this region was disrupted!