
How we compare connectivity of cloud services using RIPE Atlas latency and DNS measurements
Introduction
Internet connectivity is an important component of cloud performance. Unlike traditional data center and colocation, cloud users have little say in uplinks, peering and other connectivity related decisions. Regardless of how performant cloud systems may be, user performance will suffer if connectivity is poor.
As founder of CloudHarmony, a free source of public cloud performance comparisons (recently acquired by Gartner), I've spent a good deal of time researching and developing methods for measuring and comparing connectivity of cloud services including IaaS, CDN and DNS. In this post I'll share how we're using RIPE Atlas to produce such comparisons, and how you can access our analysis via GUI and API if they are of interest.
Complexity of Measuring Cloud Connectivity
Measuring and comparing cloud service connectivity is complex. Unlike system performance (CPU, memory, storage), which is relatively consistent, connectivity measurements depend on many factors - primarily endpoint location and network. Meaningful comparisons require a large volume of frequent and diverse measurements from many geographies and networks. I occasionally encounter simplistic cloud comparisons with overly broad conclusions derived solely from a handful of backbone based measurements. The relevance of such comparisons is negligible because they are based on a tiny sampling of data, and derived from test agents in data centers (possibly a few racks away from service being tested), not actual users in last mile networks.
Using RIPE Atlas
RIPE Atlas is one of just 2 measurement platforms I've found with sufficient geographic and network dispersion to generate meaningful cloud service connectivity comparisons (the other is a commercial service - ProbeAPI ). However, producing these comparisons from RIPE Atlas required some custom development on our part to automate probe selection, measurement execution and result aggregation. We collect 3 performance measurements with RIPE Atlas - latency, recursive and authoritative DNS query times.
Latency measurements are run against infrastructure-as-a-service (IaaS) compute and storage services (e.g. Amazon EC2 and S3), and content delivery networks (CDN e.g. Akamai, Amazon CloudFront) that support ICMP (some such as Microsoft Azure do not). DNS measurements are used for managed DNS service (e.g. Dyn, Amazon Route 53). We'd love to run HTTP RTT tests, but have been unsuccessful at getting approval to do so yet (for background information please see this RIPE Labs article: HTTP Measurements with RIPE Atlas ). Tests are run regularly against 114 cloud services and 352 test endpoints (some services like Amazon EC2 have multiple data centers to test). We obtain RIPE Atlas credits from six RIPE Atlas probes and one RIPE Atlas anchor, which we purchased and host in a colocation site in Utah.
Test Methodology
Each test iteration consists of first selecting 100 probes spanning as many unique ASNs as available in each of 13 geographical regions (i.e. US West/East/Central, EU West/East/Central, Asia, Africa, Oceania). A total of 1300 probes are selected for each test iteration. Because the API does not provide the ability to designate ASN dispersion, we periodically download and store the probes list and designate probes explicitly by ID. When measurements are submitted, we poll for results until 80% of measurements are available or 3 minutes have past - whichever comes first. The measurement results are then aggregated into time series summaries grouped by service and data center/region (e.g. Amazon EC2 / us-east-1), ASN, country, state and geographical region. Each aggregated record includes 5 percentiles (10th, 25th, 50th, 75th, 90th), mean, standard deviation and success/failure counts. We use Google BigQuery to generate the aggregated records from raw measurements.
Public Access to Results
There are 3 ways you can access our RIPE Atlas measurements and summaries:
1. Raw measurements from RIPE Atlas
All of our RIPE Atlas measurements include a unique service and region identifier in the description. You can access these measurements using the RIPE Atlas search function. Identifiers are available through the CloudHarmony API (e.g. https://cloudharmony.com/api/services). For example - try searching for aws:ec2/us-east-1 on https://atlas.ripe.net/measurements (see Figure 1 below).

Figure 1: A snapshot of the search results on the RIPE Atlas web site
2. Using the CloudHarmony website
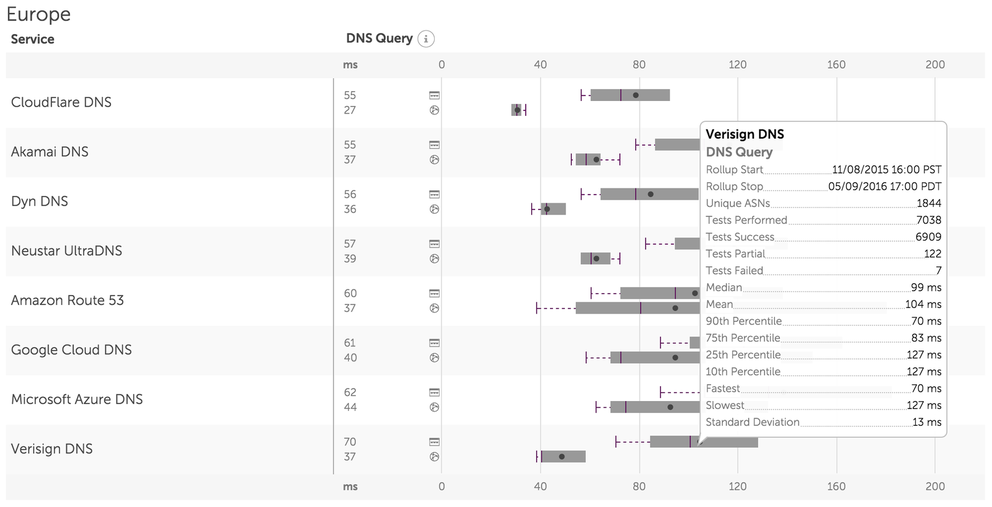
Our website includes a connectivity performance comparison tool . This tool displays our aggregated records - not individual RIPE Atlas measurements. Results can be filtered by service, country, region and ASN, and sorted by any aggregation metric (see Figure 2 below).

3. Using the CloudHarmony CloudProbe API
The comparison tool described above uses the CloudProbe API to generate the resulting comparisons (see Figure 3).


Figure 3: The CloudProbe API
This API and the corresponding parameters are documented at the link above (if prompted for an API key, any value will work). For example, this API call generates a comparison of Amazon CloudFront and Google Cloud CDN in North America based on our RIPE Atlas aggregated measurement results.
Other Sources of Data
In addition to RIPE Atlas, we also collect connectivity measurements from 3 other sources:
1. CloudHarmony.com Network Test
A browser based measurement tool enabling users to measure and compare connectivity to public cloud services in real time using only their browser. This is a custom test we developed that uses static image and javascript files to measure HTTP RTT, throughput and recursive DNS query times. Results from these tests are provided to users as they complete, and fed into another aggregated data source for comparisons (see an example in Figure 4 below).

2. CloudHarmony Synthetic Test Network
We maintain a network of 220 backbone based test agents and use them to continually measure cloud connectivity. Results are fed into another aggregated data source for comparisons.
3. Cedexis
Cedexis collects billions of last mile connectivity measurements daily used to optimize their load balancing services. Through a data sharing arrangement, we republish metrics from their metrics in our comparison tool and CloudProbe API .
Comparisons and data from each of our 4 data sources are presented independently in the comparison tool and API. They are not combined in any way.
Conclusion
RIPE Atlas is an excellent tool for measuring and comparing connectivity of public cloud services. It is our preferred source of cloud connectivity comparative analysis out of the 4 sources we collect data from.
Comments 1
The comments section is closed for articles published more than a year ago. If you'd like to inform us of any issues, please contact us.
Jasper •
Great article and very creative use of Atlas and supporting tools!