
We're switching to a new back-end solution for storing RIPE Atlas measurement metadata. Here's a detailed look at how those back-end changes have impacted front-end design.
Since its inception RIPE Atlas has stored tens of millions of measurements, none of this data is discarded but is stored in MySQL (for the metadata of the measurements) and HBase backends (for the results).
We've always known that we would hit a limit if we wanted to continue to make all measurement metadata available through MySQL alone. So, after careful deliberation the team decided to deliver all metadata for measurements through ElasticSearch. Some of the benefits of this switch are lower latency on retrieving (historical) measurement data and more elaborate search possibilities.
Back to Front
We'll be looking at the back-end switch in a future article. For now, we want to talk about some of the more obvious front-end changes users are going to encounter as of next week.
One of the implications of changing to ElasticSearch is that we had to decouple our front-end web interface (UI) completely from the back end for all pages that included measurement metadata. The measurement listing page has already been refactored to accommodate these changes without drastic changes.
For the measurement detail page, the team decided to take the opportunity to overhaul this page completely. Over time this page has accumulated a lot of cruft from all the things that were bolted on, like new measurement types (wi-fi) and other new DNS options. The measurement detail API in the meantime changed considerably and some of the data was presented in a different way (or not presented at all) in the UI.
Another consideration for the revamp of the measurement detail page was that we wanted to focus more narrowly on what we perceive to be the target users of the detail page. The old UI was a sparse, undocumented view of the measurement metadata. With an analysis of the way our users use the measurement detail page we figured out that they are mainly first time and inexperienced users. Power users drop down to using the API directly to create measurements and to retrieve the metadata as quickly as possible. So we wanted to make a new UI that would document the metadata better and would interpret the metadata where possible.
The initial view of a measurement detail as shown here presents a series of collapsed panels. The idea is that this view gives a good summary of all features of the metadata at first glance.
The User Interface
So, the new UI.

The initial view of a measurement detail as shown here presents a series of collapsed panels. The idea is that this view gives a good summary of all features of the metadata at first glance.
Every panel that has more detailed information on the theme of the panel can be expanded. An expanded view of the first panel looks like this:

Each field in all panels has its own descriptive text. Likewise, all date(times) mentioned feature a tooltip that converts UTC date-times - the default in RIPE Atlas interfaces - to the local time and UNIX timestamps.

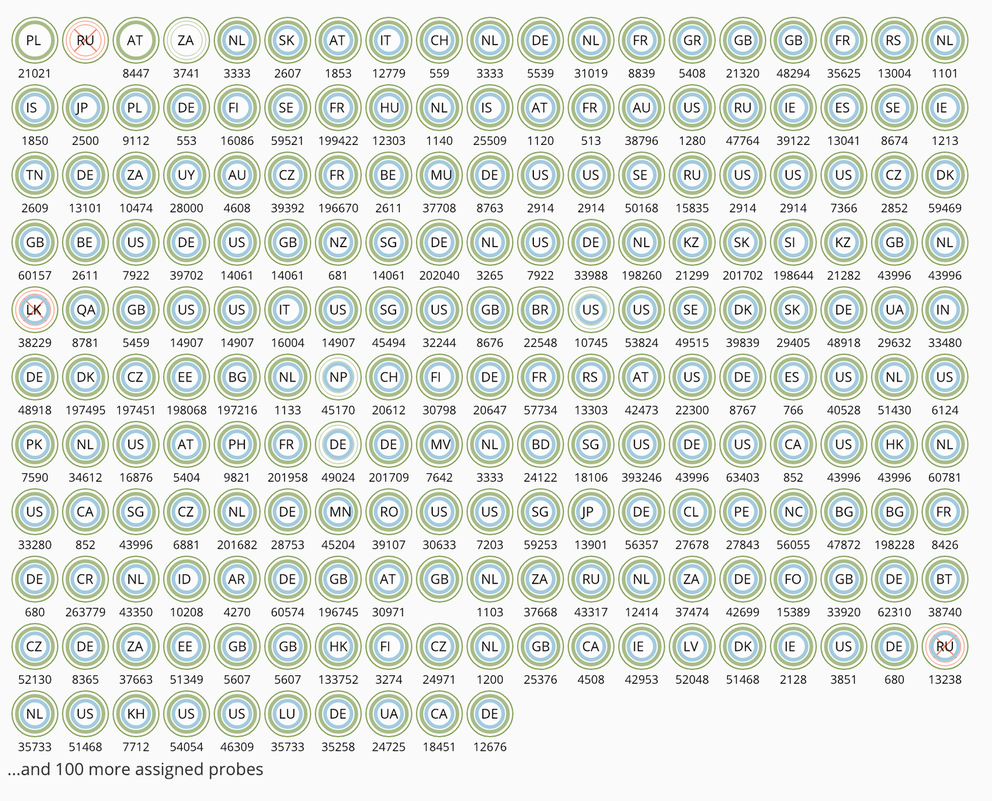
Probe Information
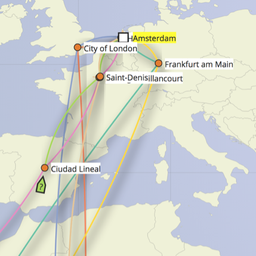
The probes panel deserves special mention here. It features two distinct visualisations of the probes involved in the measurement. The first one is a view of all probes represented by circles. Each circle represents one participating probe together with metadata for the probe; i.e. its Autonomous System (AS), county (code), online status, and so on.

The included legend doubles a display options selector and allows the user to aggregate the probes on country or AS:

This allows the user to get an indication of the probe distribution per AS or per country in one glance.
Tags for Project Annotation
Another feature the team hopes you find useful is the annotated "tags and projects" panel. When the RIPE Atlas system encounters a tag set on a measurement that it knows to be associated with a project it will give some summary information about that particular project. Right now we've added a few of our own projects, but the team would like to support third party projects here as well.

Better Responsive Experience

Up to now little to no attention has been paid to the user experience on mobile and other small screen devices. The new measurement detail page is the first where we've tried to handle the whole range of responsive experiences as first class citizens. Although there is still some roughness around the edges - e.g. it is very hard to test for all possible small devices - we think we can now provide a usable experience on most devices as well as really small browser windows.
Future Work
Even though the new UI will be put in production soon (it is already available as a link from the old measurement detail page) it will be a work in progress for quite some time. First of all, we will do more thorough browser testing and improvements. Bug-fixes will be implemented as a result of this. Second, there are features which are now implemented with limited capabilities that we're seeking to improve given enough interest. Third, the results related tabs in the UI (latest results, map, download and the different visualisations like LatencyMon, TraceMon, etc.) are left untouched for now, but will probably also be overhauled in the same fashion as the main tab. Instead of a big bang release that replaces all these features we would like to gradually improve them and roll those out gradually in concert with the feedback of our users.
In the longer term, we would like to treat this measurement detail page as the nucleus for the redesign/refactoring of the complete interface of all core features of RIPE Atlas, i.e. measurements and probes. Besides a greater coherence in the look and feel of the complete RIPE Atlas web application, the goal here would be to no longer treat the probes/measurements listing and detail pages as separate web pages, but as interactive components that can be mixed and matched according to the user chosen context in which they appear.
Try it Now!
As already mentioned you can try the new UI right now, although it is not in production yet. If you go to the measurement listing page and pick a measurement, you'll be presented with the current measurement detail page with a top banner with a link to the new UI. You can also go directly to the new interface by prepending /canary to the URL of the measurement, e.g. https://atlas.ripe.net/measurements/8345845/canary
Next week we will swap out the new and the current interface, so that the new interface will become the default. Once we've switched our backends to use ElasticSearch, the old UI will be disabled.
We would love to get your feedback on the changes we've outlined here. If you have any comments about things you would want added or altered, let us know about it in the comments section or contact us at atlas@ripe.net.
UPDATE: As of 31 January, the new user interface described about is now the default UI for RIPE Atlas measurement details.
Comments 0
The comments section is closed for articles published more than a year ago. If you'd like to inform us of any issues, please contact us.