With the increasing number of real-time applications (online games using virtual reality, multi-site financial transaction processing) and the radically new business models and use cases introduced by the 5G mobile architecture (robotics, tactile Internet) requiring interactive back-and-forth communication, user-perceived end-to-end latency is becoming an all-important factor for both users and network providers.
While there are many network monitoring systems in use, they usually provide coarse measurements that only report metrics and do not infer individual user-perceived performance, for example, port statistics.
Other monitoring approaches, including PerfSONAR, operate with synthetic, generated traffic and only provide measurements between a set of hosts that can be far away from actual end users. Therefore, these approaches also cannot provide appropriate insights into traffic dynamics over short timescales for events such as flow-level micro-congestion or sudden latency changes.
In order to understand the nature of latency over the Internet, Ruru was born – a realtime, passive monitoring system developed in collaboration with REANNZ, New Zealand’s Research and Education Network provider.
Ruru runs on a commodity server using a Data Plane Development Kit- (DPDK) enabled network card and calculates the round-trip time (RTT) on all individual TCP flows of users to understand wide-area latency.
Ruru also maps source and destination IP addresses to geographical locations as well as to Autonomous System Numbers (ASNs), and visualises these measurements in high speed on a 3D WebGL-enabled map interface. Moreover, Ruru aggregates statistics by source and destination locations as well as ASNs, and allows a realtime understanding of wide-area latencies.
Architecture of Ruru
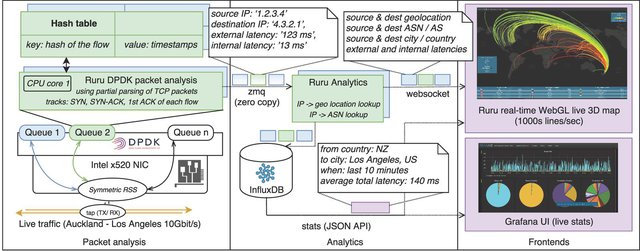
The system comprises three main parts:
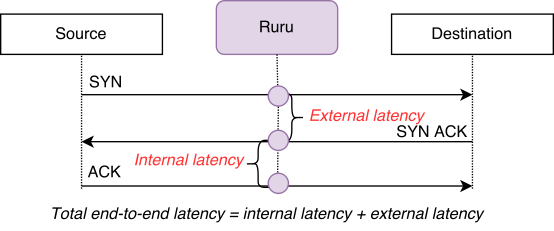
1. Ruru DPDK packet analysis (written in C / multi-threaded): This software measures the elapsed time between SYN, SYN-ACK and the first ACK TCP packets (as shown below) for all TCP streams. We have chosen to use DPDK to keep up with the speed of international links — DPDK applications allow us to process 64 byte packets coming with a speed of 40 Gbit/s. After calculating latency, this module sends the measurement information (source IP, destination IP, latency [in microsecond]) on ZMQ sockets to the Ruru Analytics part.

Figure 1: Ruru measures the elapsed time between SYN, SYN-ACK and the first ACK TCP packets for all TCP streams.
2. Ruru Analytics (written in C / multi-threaded): This component retrieves AS / geotag / proxy information for all IPs (using IP2location.com databases) in the measurement data received from the DPDK packet analysis and generates basic statistics. It pushes geo-tagged information in JSON format on ZMQ sockets to the frontends and saves the measurements in InfluxDB, a time-series database. For privacy reasons, original IP addresses are dropped right after a geographical location is retrieved and therefore they are never saved or visualised.
3. Ruru Frontend: In a web browser, Ruru visualises multiple thousands of connections per second on a live 3D map. To achieve such high performance, we have used the WebGL API with the MapGL wrapper to render 3D objects on top of a world map by directly using the graphic card of the client machine. Apart from the live map, the Grafana UI also shows statistics and graphs of the measured end-to-end latency (for example, min, max, median, mean) for a required time interval (InfluxDB takes care of indexing data on geo-location and AS information).

Figure 2: Overall architecture of Ruru
Applications of Ruru
Since December 2016, Ruru has been deployed on a Dell PowerEdge commodity server, physically tapping a 10Gbit/s international link carrying real user traffic between Auckland (NZ) and Los Angeles (USA) — this link is one of REANNZ’s two international commodity links out of NZ.
While in operation, Ruru has been used for detecting anomalies and was able to find very fine-grained micro-glitches in latency that no other monitoring system had previously identified. For example, we have found that a periodic firewall update was causing a 4,000 ms latency increase on all connections that were started within a specific, very short time period each night. This 4,000 ms increase had not been noticed by conventional measurement tools (SNMP polls), however, it was clearly shown in our Grafana UI. Other types of anomalies, including unusual number of TCP connections between two locations or SYN floods, can also be identified in realtime with simple Ruru modules.
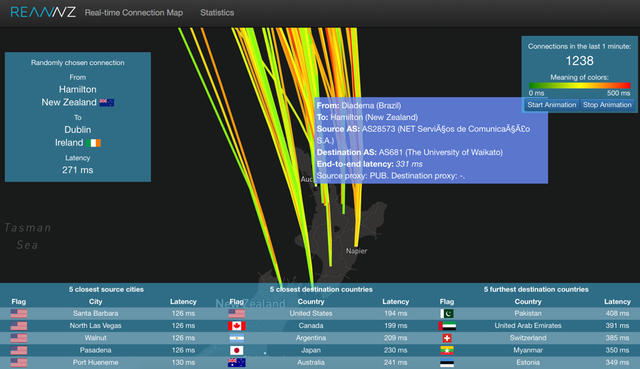
Ruru can also be used to visually alert operators to latency anomalies. By inspecting the live 3D-map, operators can observe how the colour of the arcs changes between certain locations (as shown below).

Figure 3: Ruru map showing traffic source and destination. The colours represent the RTT: red lines in areas where most lines are green show increased latency for some connections. Operators can hover on any link and see the details.
Ruru is entirely open source and easy to deploy: https://github.com/REANNZ/ruru
I presented this at RIPE 75 in Dubai. You can find the video and slides here.


Comments 0
The comments section is closed for articles published more than a year ago. If you'd like to inform us of any issues, please contact us.