
If you monitor your external Internet connectivity, you may wonder which machine is the best to ping. Hesitate no more - you can use RIPE Atlas anchors as landmarks.
Introduction
You may need to check and monitor the Internet connectivity on your site because other tests or services (for instance the reachability of your outside servers) depend on it. Or maybe you want to monitor it to find out how reliable your Internet access provider is.
It is common practice to ping a certain machine as a landmark to verify your Internet connection. You may use a machine which belongs to you, one outside of your premises or a public Internet server. Using a public Internet server, for example Google Public DNS, is questionable. It's not your machine, it is not free to use and it may stop answering pings at any moment (this is the case with www.ripe.net and labs.ripe.net). If every small LAN pings 2001:db8:433::1 (the example IPv6 adress) every three minutes, and there are ten millions small networks doing it, 2001:db8:433::1 will receive 50 kp/s. This is reminiscent of a famous problem of many machines banging on one server.
Having public services explicitly devoted to these ping tests would be nice. There are a few such as fap.cymru.com , ping.rezopole.net or ping.ovh.net . They do not appear to be clearly documented (with usage policy), maybe because their managers do not want to attract too much attention.
But one landmark is not enough. Each landmark, even well-connected and professionally managed, can break or be unreachable. You don't wan't to receive a warning from your monitoring system at 2:00 in the morning if a remote landmark, that you do not control, went down. You need to ping N different machines, and you need to decide that there is a problem only if M of them (with M < N) are unreachable. If only there was a better way...
RIPE Atlas anchors
...but wait, there is! With RIPE Atlas anchors , you can have many pingable machines at your disposal. These servers are located in many places around the world ( complete list online ). Their main job is to be used as targets in measurements, typically by the RIPE Atlas probes . Using the anchors to monitor Internet connectivity is less common but very useful.
Monitoring plugins
For the rest of this article, I'll discuss the use of the monitoring software Icinga . Icinga is a fork of Nagios, it is free software and it uses the same monitoring plugins as Nagios and the other programs derived from Nagios.
One of these plugins, check_cluster , is part of the standard Monitoring Plugins distribution and performs tests on several machines and raises an alarm only if more than a given threshold are down (you choose the threshold). To configure it, you create a group :
 define hostgroup{
        hostgroup_name  Anchors
        members         anchor-eu,anchor-us,anchor-fareast
}
Then, you make a template for RIPE Atlas anchors and each item of the group (here, I will define only the first anchor):
 define host{


 name anchor-host


 use generic-host


 check_command check-host-alive


 check_period 24x7


 check_interval 5


 max_check_attempts 3


 notifications_enabled 0


 register 0 }


 define host{
        use                     anchor-host
        host_name               anchor-eu
        address                 fr-cdg-as2486.anchors.atlas.ripe.net
}
The template has some quantitative parameters (such as testing every five minutes) and a very important "notifications_enabled 0". We don't want notifications for every host (a given anchor may come and go) but only for the global service. We now define this service:
 define command{
       command_name     check_cluster_host
       command_line     $USER1$/check_cluster --host -w $ARG1$ -c $ARG2$ -d $ARG3$
       }
 define service{
        use       generic-service
        service_description Internet connectivity
        hostgroup_name Anchors
        check_command   check_cluster_host!1!2!$HOSTSTATEID:anchor-eu$,$HOSTSTATEID:anchor-us$,$HOSTSTATEID:anchor-fareast$
        notifications_enabled 1
  }
The two numbers on the definition of the service (1 and 2) are the number of hosts that need to be down before Icinga declares it to be a warning or a critical problem. The variable HOSTSTATEID tells check_cluster that it needs to compute the result from the state (up or down) of the given hosts. From now on, you will receive alerts from Icinga if two or more of the anchors are down or unreachable.
If you want to run other tests on the RIPE Atlas anchors (the anchors have a HTTP server, so you could have HTTP tests), you just define it using the same group.
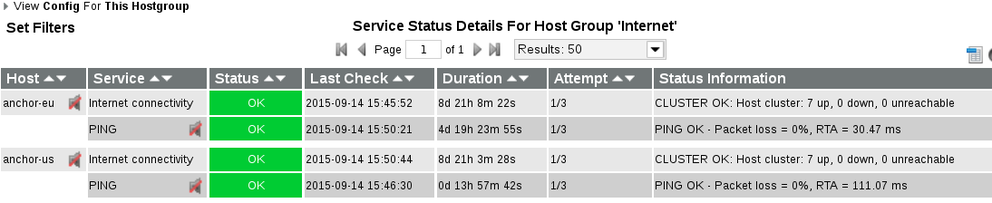
The web interface of Icinga displays the group this way:

Note here that anchor-us has been down for a few hours but the uptime of "Internet connectivity" is not affected.
An alternative to the monitoring plugin check_cluster is to use check_multi. Unlike check_cluster, it is not part of the official monitoring plugins and you'll have to download it separately from the website and compile it (as of today, the internal tests of the software seem quite broken ). (Most of what follows have been copied from the article " Clustered Checks with Icinga and check_multi "). You then configure it:
 define command{


     command_name        check_multi


     command_line        /usr/local/nagios/libexec/check_multi -f /etc/icinga/conf.d/$ARG1$ $ARG2$


    }


 define  service {


         use   generic-service


         host_name                       localhost


         _anchor_parameters              "-w 30.0,5% -c 100.0,10%"


         service_description             PING-ANCHORS


         check_command                   check_multi!test-anchors.cmd!-s ANCHOR_PARAMETERS=$_SERVICEANCHOR_PARAMETERS$


 }
Please note that there is another configuration file, specific to check_multi, here test-anchors.cmd. Its content is:
 command[ AFNIC ]  = /usr/lib/monitoring-plugins/check_ping $ANCHOR_PARAMETERS$ -H fr-cdg-as2486.anchors.atlas.ripe.net


 command[ France-IX ] = /usr/lib/monitoring-plugins/check_ping $ANCHOR_PARAMETERS$  -H fr-par-as57734.anchors.atlas.ripe.net


 command[ SDV ] = /usr/lib/monitoring-plugins/check_ping $ANCHOR_PARAMETERS$  -H  fr-sxb-as8839.anchors.atlas.ripe.net


 command[ Rezopole ] = /usr/lib/monitoring-plugins/check_ping $ANCHOR_PARAMETERS$ -H fr-vbn-as199422.anchors.atlas.ripe.net


 state   [ CRITICAL   ] = COUNT(CRITICAL) > 2


 state   [ WARNING    ] = COUNT(WARNING) > 2 || COUNT(CRITICAL) > 1


 state   [ UNKNOWN    ] = COUNT(UNKNOWN) > 1
Here I define four RIPE Atlas anchors, then I tell check_multi to monitor them with the plugin check_ping, with parameters "critical if more than 100 ms of RTT or more than 10 % packet loss". Adjust these parameters depending on your location and the closeness of the chosen anchors. In the example above, all the anchors pinged are in my country, France, and so are quite close.
Another important thing to configure in check_multi are the thresholds. Here, we say that the state is critical if more than two anchors are themselves in a critical state. So, we won't be disturbed by alarms if only one or two anchors are unreachable.
Which one to use: check_cluster or check_multi? check_cluster is easier to install since it is part of the standard library. check_multi is easier to configure (although the fact it has a separate configuration file, with a new syntax, is problematic) and produces less clutter in the web interface.
Conclusion
There might be reasons why you want to monitor the external Internet connectivity of your network. Now you can use RIPE Atlas anchors to do that. They are available as measurement targets in many locations around the world. Monitoring plug-ins such as check_multi or check_cluster can help to automate that.


Comments 2
The comments section is closed for articles published more than a year ago. If you'd like to inform us of any issues, please contact us.
Janusz Jezowicz •
Hello Stephane, The RIPE Anchor list link does not work, it goes to 404 page - https://atlas.ripe.net/about/anchors/list/ Regards, Janusz
Mirjam Kühne •
Thanks for pointing this out, Janusz. This has been fixed.