RIPE Atlas users can now travel back in time to access all of the historical data collected by RIPE Atlas. This data is now visualised with the new "time travel" feature, available for both Internet maps and measurement results. Here we explain how to make the most of this new feature to visualise changes to infrastructure, interesting network events and more.
Introduction
With more than 8,700 probes connected around the globe and 3,000 measurement results collected each and every second, suffice it to say that RIPE Atlas has collected a lot of data in its lifetime. Much of this data is visualised in Internet maps and made available via the measurement results web interface for the present moment, but until now, users who wanted to look back in time could only access the wealth of historical data collected by RIPE Atlas using an API.
We're pleased to announce that you can now see all of this data visualised before your eyes with the handy new time travel feature that we've made available as part of the RIPE Atlas web interface. Permalinks are also available and maintain any filtering options you've set, so you can easily share interesting views with others.
Internet Maps
Time travel is available for the five following Internet maps:
- DNS Root Instances
- Comparative DNS Root RTT
- Root Server Performance
- RTT to Fixed Destinations
- Reachability of Fixed Destinations
This means you can now go back to view the situation at any point in time that you specify, either by using the slider bar or by entering a specific time in the input field at the bottom of the maps.
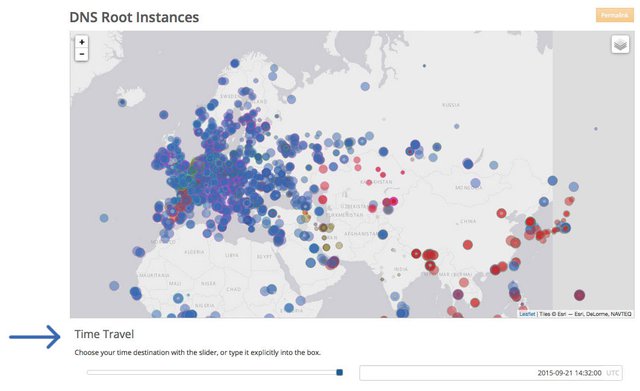
Measurement Results
Time travel is also now available for the measurement results of any ongoing measurement for which historical data is available. On the measurement results page, there is an orange "time travel" button at the top right of the page when you are on the probes or map tab view. You can see the list of measurement results for the historical data (on the probes tab) or see it visually represented on a map (on the map tab). Again, you can use the slider bar to define a time period or enter a specific time in the input field.
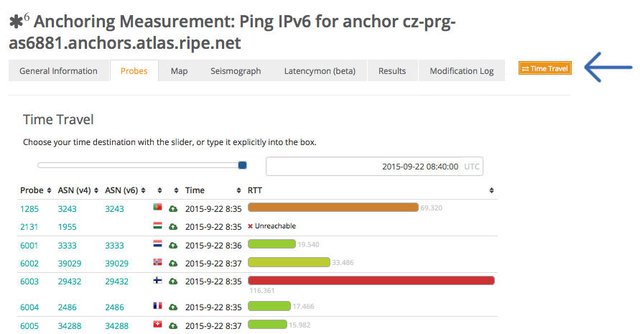
The time travel button is available on the measurement results page
Use Cases
Comparison before and after adding a K-root instance
It's now easy to compare the situation before and after a particular change or event. For example, we can look at the effect of adding an instance of a root name server on the surrounding DNS infrastructure.
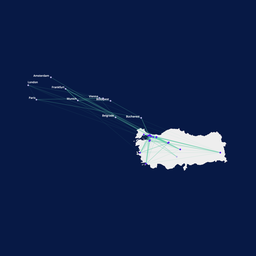
At the end of April, a new K-root node was added in Iran. Below you can compare the situation before and after adding this node, and see how DNS queries that used to be answered by root name servers in Europe are now answered locally.
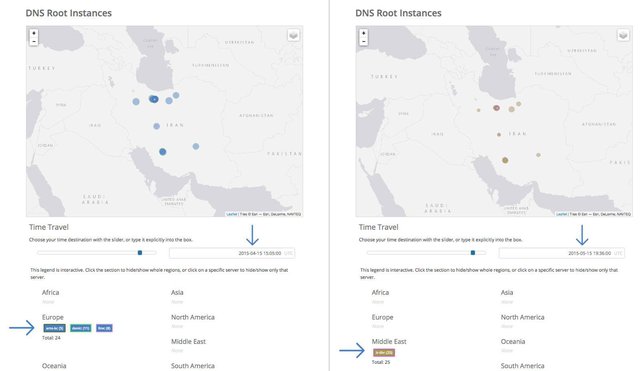
Network Outage
You can also use time travel to show the effect of a wide-scale outage, such as the one that AMS-IX experienced in May 2015.
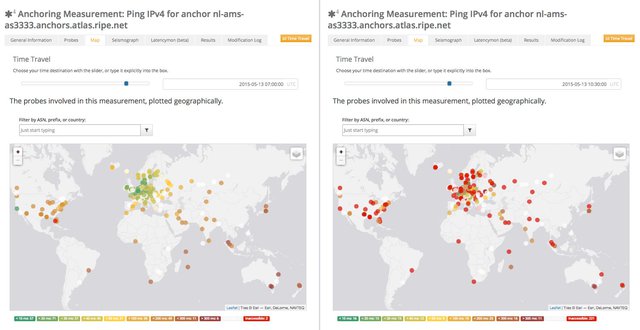
Time travel also shows the difference in connectivity before and during a major network outage
Conclusion
We hope that you will find your own uses for the time travel feature in investigating interesting past events - or future ones we don't yet know about...If you do come across anything that might be of interest to the community, please let us know! Better yet, why not write a RIPE Labs article about it? Everyone is invited to share their ideas and discoveries on this community platform.
Feedback
We always want to hear what you think about the tools and services we offer. Here's how to get in touch:
-
Leave a comment about this specific article below
- Please subscribe to the RIPE Atlas mailing list for discussions with active users and RIPE Atlas developers: ripe-atlas [at] ripe [dot] net
- If you want to report a bug or problem: atlas [at] ripe [dot] net



Comments 0
The comments section is closed for articles published more than a year ago. If you'd like to inform us of any issues, please contact us.