
Poor internet performance is often blamed on the network speed delivered by an ISP. While local data transmission speeds can contribute to a bad user experience, there are many other potential culprits. Problems such as the number of devices consuming available bandwidth, the round-trip distance a signal must travel to deliver content, and malfunctioning equipment can also contribute. Consumers understandably blame their ISPs for poor service, when the real problem may originate deeper in the network.
The relationship between NetForecast and RIPE Atlas
Since 1999, NetForecast has been conducting in-depth analyses of Internet performance to uncover where Internet degradations occur and how they impact the end-user experience. As Internet dependence and usage grow, service quality is becoming increasingly important—requiring better measurements and insights. Networks are becoming ever-more sophisticated, with services traversing intricate webs of separately controlled data centers, routers, interconnected middle-mile networks, and 'last-mile' technologies. Current speed tests and other legacy measurement techniques cannot measure the end-to-end performance along complete network paths.
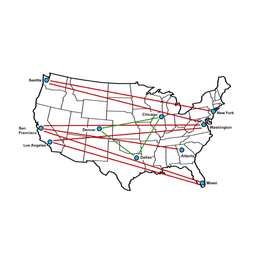
Utilising the RIPE Atlas network, NetForecast runs numerous concurrent tests from approximately 400 RIPE Atlas probes equally distributed across the continental US. Tests are conducted between RIPE Atlas probes to RIPE Atlas anchors and client servers. Ping and traceroute data from probes feed our proprietary software solution called QMap. NetForecast’s QMap automatically aggregates the data and applies advanced algorithms and artificial intelligence to generate latency and reliability reports for network service providers. Traceroute information is used to locate issues identified by the latency reports.
NetForecast also gathers and combines data from tests performed via our QMap mobile application and Automated Test Units. The resulting QMap output can show a network service provider the end user Quality of Experience (QoE) across applications and services, and help pinpoint network performance issues within the first, middle, and last mile networks.
QoE versus QoS
Service Level Agreements (SLAs) are common benchmarks used to set expectations for measurable results a service provider delivers to its customers. While SLAs monitor the Quality of Service (QoS) for individual components, the information is only available from elements along the user’s path that measure and report local performance. Not all elements provide this information. Therefore, QoS reports from these elements provide only scattered, partial views making it impossible to know if QoS data accurately reflect users’ actual experience.
Utilising ping and traceroute data collected from the RIPE Atlas network, along with our supplemental data, NetForecast QMap provides a holistic view of all of the elements in the user’s end-to-end path—thus measuring the actual end-user experience.

Figure 1: Quality of Experience (QoE) showing end users' experience
How Internet performance impacts application performance
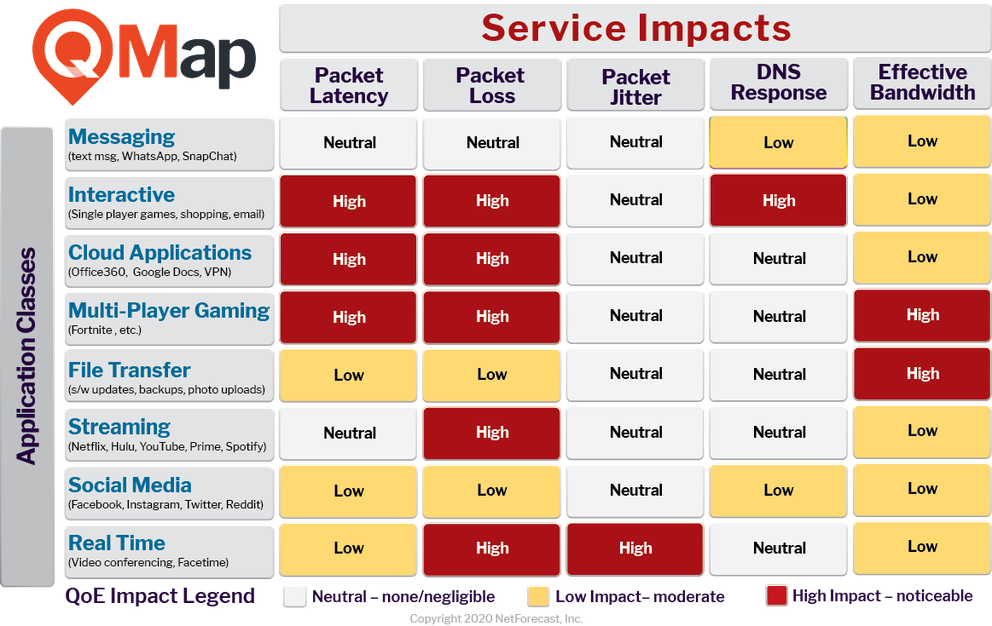
NetForecast maps a representative set of application types to five network performance metrics:
- Packet latency
- Packet loss
- Packet jitter
- DNS response time
- Effective bandwidth
Changes within these metrics can influence a user’s QoE for each application class. Primarily, we look at packet latency and loss because variations in these metrics tend to have the highest impact on the end user's experience. High latency occurs when a data packet's Round-Trip Time (RTT) has a significant delay or increased delay from long-term baseline. Ideally, this metric should be as close to zero as possible, as the longer data packets take to travel from the requester to their destination, and back again, the higher the negative impact on the end-user experience. We've all experienced and felt the pain high latency issues create when waiting for content to load from a slow web page.
NetForecast maps landline and mobile-connected end users’ QoE across many application types, including streaming, social media, and online shopping. As shown below, some applications are much more sensitive to changes in network performance metrics than others. For example, packet loss or jitter have a high impact on the end-user’s experience with video conferencing services or apps such as Facetime. Network service providers can use this information to optimise their networks’ performance to provide the best QoE for applications that matter most to their users. Application providers can also use the matrix to focus on particular network issues related to their service when developing monitoring systems.

Figure 2: Measuring QoR for various application types
Airline Industry Case Study
We've been applying our QoE technology to the airline industry to help airlines improve passengers’ inflight Wi-Fi experience. Using the QMap Mobile testing app coupled with our processing and logic engine, we actively test the end-to-end network performance of Wi-Fi on individual flights. Once airborne, users verify their flight information (such as airline, flight number, and seat location), which automatically triggers QMap Mobile to send a test sequence to measure popular services such as google.com, youtube.com, facebook.com, etc. These over-the-network measurements are then continually correlated with NetForecast’s vast ongoing ground-based measurements, enabling us to monitor inflight QoE. The results are mapped to service performance based on application class, as shown in the service impact matrix above. NetForecast clients receive a full suite of test results and reports enabling them to detect and resolve Internet performance problems across the entire service path.
About NetForecast
NetForecast is the only third-party provider measuring end-to-end broadband performance, providing unbiased and reliable insights to the cable, mobile, fixed-line, satellite, and transportation communities. At a time when digital connectivity matters more than ever, NetForecast helps ensure quality and accuracy across an increasingly complex ecosystem of partners. To learn more, follow us @net4cast.
Comments 2
The comments section is closed for articles published more than a year ago. If you'd like to inform us of any issues, please contact us.
Bas Janssen •
The post mentions "RIPE Atlas probes equally distributed across the continental US".... Any plans to expand this to EU located Atlas probes in the future?
Alan Jones •
We look forward to expanding our data gathering to EU-located probes, and would like to discuss this with interested parties.