So you installed a smart plug in your home. It works perfectly. But do you really know what data it’s sending, and where? Is it respecting your privacy? Is it even following the law? A research project supported by the RIPE NCC Community Projects Fund delves into uncertainties surrounding IoT devices and seeks to develop tools for more transparency.
The Challenge: Black box analysis for IoT
Internet of Things (IoT) devices have become part of our daily lives: connected, automated, and mostly invisible. Yet this invisibility often extends to how they behave on the network. For most users and even network operators, it’s nearly impossible to know whether a device is communicating only what’s necessary, whether it’s silently leaking data to third parties, or if it’s adhering to privacy regulations like GDPR or the upcoming Cyber Resilience Act.
Gaining this kind of visibility typically requires intrusive setups or complex monitoring systems that aren’t suited to real world deployment in home or small office environments. That’s why our project takes a different path: we bring intelligent, real time traffic monitoring directly to consumer routers. By enabling analysis at the edge, we make it possible to observe and verify device behaviour as it happens, without relying on the cloud, without invasive methods, and without disrupting the user experience.
ML-powered traffic monitoring on consumer routers
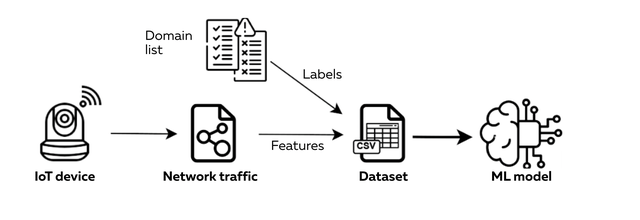
To better understand how IoT devices behave on the network, and whether their behaviour aligns with privacy expectations, we developed we developed a classification pipeline that combines feature extraction with machine learning-based traffic analysis. The end-to-end process is illustrated in figure 1, which shows how raw network data is transformed into structured inputs for classification, ultimately determining whether each communication is essential or potentially privacy-invasive.

After careful optimisation for resource-constrained hardware, the models now run directly on consumer grade routers, enabling real time detection of suspicious or non-compliant behaviour, all without affecting device performance or requiring external infrastructure.
To generate a labelled dataset, we built a controlled IoT testbed including eight consumer smart home devices across different categories and brands. As shown in table 1, each device was connected to a custom Wi-Fi access point configured to run our data collection and analysis scripts. Power was managed through smart plugs, allowing automated on/off cycles. We defined a core set of actions for each device, then used probe scripts to simulate those functions and record all outgoing network traffic. The destinations contacted were then labeled as essential or non-essential, based on whether they were required for the device’s core functionality.
| Speaker | Amazon Echo dot 3 | 2/48 | 92.6% |
|---|---|---|---|
| Speaker | Amazon Echo dot 4 | 2/46 | 94.2% |
| Camera | Yi Pro Home Camera | 1/36 | 91.6% |
| Appliance | Yeelight Bulb 1S | 1/0 | 0% |
| Appliance | TP-Link Kasa Bulb LB120 | 1/3 | 2.6% |
| Appliance | TP-Link Tapo Plug P110 | 2/2 | 0.9% |
| Hub | SwitchBot Hub Mini | 1/0 | 0% |
| Video | Roku TV Stick | 1/120 | 81.1% |
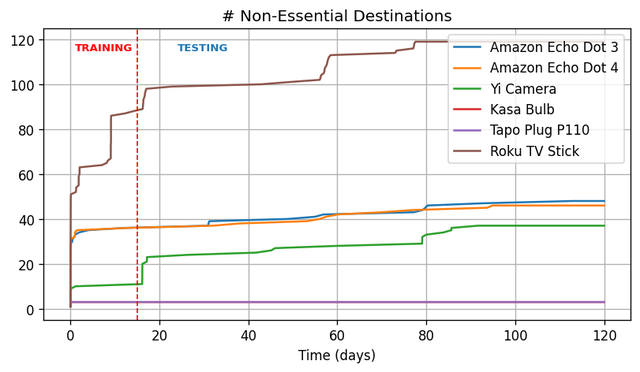
The distribution of non-essential destinations over time varied significantly across devices. Figure 3 shows how many unique non-essential endpoints were contacted throughout the data collection period. Some devices, such as the Switchbot Hub Mini and Yeelight Bulb, produced only essential traffic and were excluded from this analysis. Others, like the Tapo Plug and Kasa Bulb, made all their connections immediately at boot. For the remaining devices, we found that most non-essential destinations appeared within the first few days. This allowed us to use the first 15 days of traffic for training and the rest for testing. The classifier successfully identified previously unseen non-essential destinations in the test data with 100% accuracy.

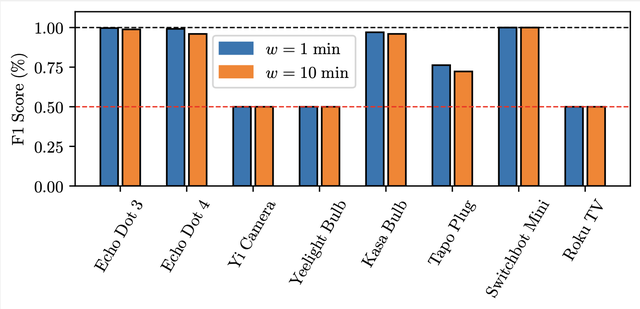
To assess how well the model generalises to new devices, we performed an all-vs-one evaluation. In each of eight iterations, the model was trained on seven devices and tested on the remaining one. The results, presented in figure 4, reveal a clear trend: the classifier performs well on devices similar in function or brand to those in the training set (e.g., Amazon Echo Dot 3 and 4), but struggles with devices that are dissimilar or unique, such as the Yi Camera. This finding underscores the importance of device diversity in the training data and suggests that category-aware adaptation may be necessary for broader generalisation.

Privacy compliance under the microscope
Our analysis of GDPR compliance revealed a concerning pattern. A significant portion of the IoT devices we tested (42%) exhibited behaviour that didn’t align with their stated privacy policies. In many cases, we observed data being sent to third party domains not mentioned in the terms of service, along with persistent DNS based tracking that continued well beyond what was explicitly disclosed to users.
Here's a more detailed breakdown of the results:
- 42% of vendors failed to disclose key data practices that were observable in traffic logs
- Devices communicated across 7+ countries, many outside the GDPR jurisdiction
- Only 35% of vendors responded to GDPR data access requests within the legal 30-day limit
- Less than one-third (30%) disclosed the identity or location of data recipients
Port usage insights - consistency vs. variability
Why is port usage important? Well, every open port on a device acts as a potential communication channel and - if misconfigured or unnecessary - also as a potential attack surface. Consistent, predictable port usage makes it easier to spot anomalies or suspicious behaviour. If a device normally only uses ports 443 and 8883 (common for encrypted communications), a sudden attempt to open port 21 (FTP) could indicate a vulnerability or even malicious activity. Conversely, devices with variable and sprawling port behaviour are harder to profile and monitor reliably, posing a challenge for real-time network defence and compliance enforcement.
These behavioural differences have practical implications: while stable devices can be effectively monitored with short, targeted observations, more variable ones require longer and more adaptive monitoring windows to capture their full range of activity. Understanding this variability helps us tailor our tools and monitoring strategies accordingly.
We studied the network behaviour of 18 different IoT devices and found a clear distinction between device categories. Cameras, sensors and smart bulbs tended to use a consistent and limited set of ports, showing stable behaviour across time. In contrast, smart plugs and controllers were far more unpredictable, with port activity fluctuating significantly from week to week.

Some devices stick to a fixed set of ports week after week, stable and predictable. Others keep changing, with new ports appearing even in the final week. This contrast reveals just how diverse and dynamic IoT behaviour can be.
We investigated how device type affects network behaviour. By analysing metrics like min, max, average, and standard deviation of observation time per category, we found a clear trend: some device types are consistently predictable, others wildly variable. This correlation helps us tailor monitoring strategies by device category.
| Category | Number of devices |
Best case (min days) |
Worst case (max days) |
Avg days | Std Dev |
|---|---|---|---|---|---|
| Camera | 2 | 1 | 1 | 1 | 0.0 |
| Smart Bulb | 4 | 1 | 1 | 1 | 0.0 |
|
Smart Hub/ Controller |
4 | 1 | 22 | 6.25 | 10.5 |
| Smart Plug | 6 | 1 | 27 | 14 | 12.33 |
| Sensor | 1 | 1 | 1 | 1 | 0.0 |
Some devices play by the rules, others change the game
Cameras, bulbs, and sensors showed stable port usage, often needing just one hour to capture full behaviour. But controllers and smart plugs were unpredictable, with constantly shifting patterns. For these, even partial monitoring (70–90%) wasn’t enough. This distinction is shaping how we design smarter, category-aware monitoring strategies.
Open-Source tools for the community
To support transparency and accountability in the IoT ecosystem, we’ve developed and released two open-source tools.
- The Port Checker Tool helps identify open or misconfigured ports on smart devices, providing a straightforward way to spot potential security gaps. It performs lightweight scans from within the local network and compares the observed port activity against expected device profiles. Users can get started by running a simple Python script or using the provided Docker container - no special hardware required.
- The IoT Gateway Inspector is an early-stage implementation of our machine-learning-based traffic profiling system, designed to run directly on consumer routers. Once installed, it passively monitors device traffic in real time and flags unusual patterns based on learned models. It’s optimised for resource-constrained environments and can be deployed on OpenWrt-compatible routers using pre-configured packages and setup scripts available on GitHub.
Both tools are built to be practical and accessible, giving developers, network operators, and end users greater visibility and control over how their devices behave on the network.
What’s next?
Looking ahead, our work is focused on expanding the scope and impact of the project. We're broadening model coverage to include a wider range of IoT devices, ensuring that our approach remains robust across different categories and manufacturers.
At the same time, we're fine tuning the timing and frequency of monitoring to strike the right balance between accuracy and efficiency.
On the standards front, we’re finalising contributions to IETF drafts and a RIPE BCOP document, helping to translate our findings into practical, community-driven guidelines.
Finally, we’re deepening collaborations with ISPs, hardware vendors, and members of the RIPE community to test and refine our tools in real world environments.


Comments 0