
One of the most important but often overlooked criteria when choosing a hosting provider is the performance of its network. Poor network performance for any kind of online service leads to low customer satisfaction. What is the best way to measure network performance that most accurately simulates a customer's experience with a network? We found this question to be an interesting idea to explore during a Leaseweb hackathon!
RIPE Atlas
RIPE Atlas is the RIPE NCC’s main Internet data collection system. It’s a global network of devices, called probes and anchors, that actively measure Internet connectivity. Anyone can access this data via Internet traffic maps, streaming data visualisations, and an API. RIPE Atlas users can also perform customised measurements to gain valuable data about their own networks.
Due to the size and reach of the RIPE Atlas project, it’s one of the most important Internet measurement initiatives internationally. What’s great is that the project is run by the RIPE NCC, but driven by the global community of RIPE NCC members (and non-members!) who contribute some of their resources to help the project. This improves visibility into the inner-workings of the global Internet. It’s used by Internet professionals all over the world to improve quality of their network, debug issues, and learn. Leaseweb contributes to the RIPE Atlas infrastructure by hosting seven RIPE Atlas anchors in various data centers all over the globe.
Since Leaseweb already contributes to RIPE Atlas with these anchors, it’s an obvious choice to use measurements of random RIPE Atlas probes against those anchors and compare them with other infrastructure providers’ anchors. The main elements needed to use RIPE Atlas are measurements, sources and targets. These elements all have their own function to facilitate experiments.
Getting The Data
Triggering one-off measurements and fetching the results of those measurements can be done using the RIPE Atlas API. The RIPE NCC also developed a wrapper around the RIPE Atlas API to allow anyone to communicate with the RIPE Atlas API using Python. It is maintained by RIPE Atlas developers and is therefore the best choice for consuming their API. Using it requires an API key. The Wrapper is open-source and available on GitHub.
The installation is very simple using pip:
$ pip install ripe.atlas.cousteau
Included classes in the Python script:
from ripe.atlas.cousteau import (
Ping,
Traceroute,
AtlasSource,
AtlasCreateRequest,
AtlasLatestRequest
)
Measurement Types
RIPE Atlas offers several measurement types: Ping, Traceroute, DNS, SSL, NTP and HTTP (only towards anchors). Creating a measurement allows you to specify a type of test (or ‘experiment’) to perform. Typically, these have something to do with latency for a service, but there are also options to check things like resolving a domain name and checking DNS propagation. These measurements can be one-off or recurring. For our Hackathon project we used one-off measurements.
Sources
RIPE Atlas probes defined as sources are used to trigger the measurement. They can be defined explicitly or taken from a pool (area, country, prefix or AS number). Below, the defined source takes 50 random probes from Europe to be used as a source of measurement.
source = AtlasSource(
    type="area",
    value= "North-Central",
    requested=50
)
Targets
Targets refer to IP addresses that the measurements are run against. In this example, ping is run against one of the Leaseweb’s anchors.
pingLSW = Ping(
    af=4,
    target="5.79.112.97",
    description="Ping nl-haa-as60781.anchors.atlas.ripe.net"
)
Create Request
Defining a request combines all of the elements together: measurements and sources. It also requires a start time, API key and – in this case – a one-off flag.
atlas_request = AtlasCreateRequest(
    start_time=datetime.utcnow(),
    key=ATLAS_API_KEY,
    measurements=[pingLSW, pingOVH, pingAzure, pingAWS, pingUni],
    sources=,
    is_oneoff=True
    )
Here is a summary of what this request will do:
- We specify a number of ping tests to various endpoints
- We specify where we want to have those request come from and how many we want
- …and we bundle those tests into a single one-off request
Calling the RIPE Atlas API now is simple:
response = atlas_request.create()
After calling this function, RIPE Atlas will launch tests towards 50 random probes in the area we specified, and will store the results.
Returned values, stored in the response, are measurement counts. In this case, there are five values as there are five measurements defined. The actual results have to be retrieved separately, so the next step is fetching the measurement data. Here, class AtlasLatestRequest is used:
results = AtlasLatestRequest(msm_id=measurement_id).create()
The results variable now has stored all of the measurement details needed to calculate and compare latencies. It’s clear to see how powerful RIPE Atlas is. In a few simple lines we’ve generated latency information from 50 end points to multiple targets!
Visualising Data
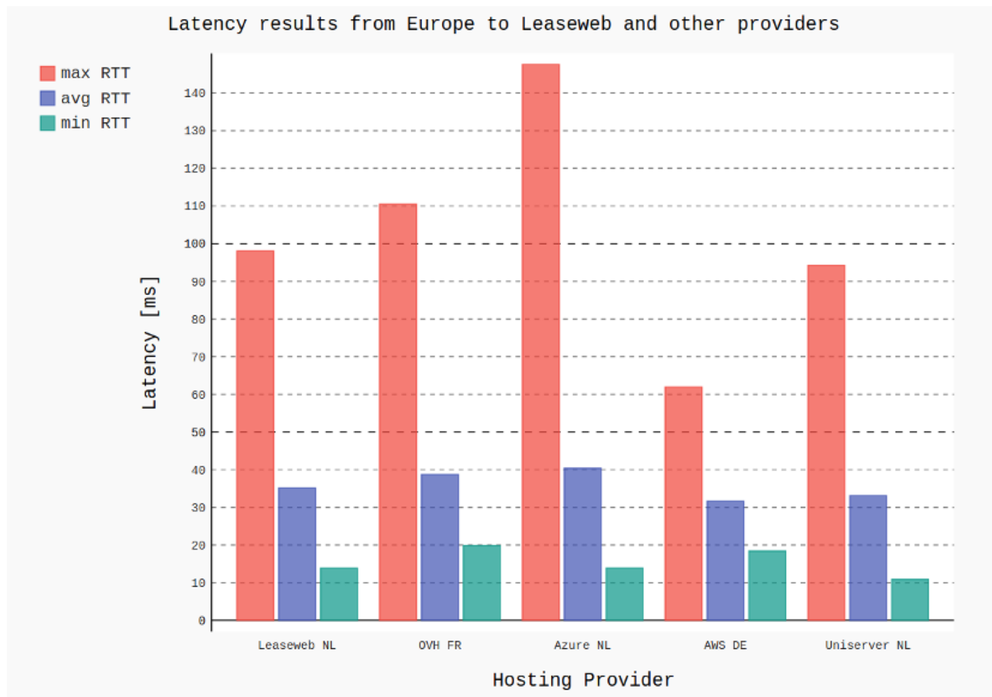
Visualising data that was fetched from the RIPE Atlas API was done with the pygal Python library that supports various chart types and styles. For this Hackathon project pygal.Bar() was used to draw out the comparison results. (Pygal usage is out of the scope of this blog post). The two charts below show the data from measurements taken from Europe and from Russia.

Figure 1: RIPE Atlas measurement results from 50 probes in Europe towards the Leaseweb RIPE Atlas anchor

Figure 2: RIPE Atlas measurement results from 50 probes in Russia towards the Leaseweb RIPE Atlas anchor
Conclusion and Going Forward
This Hackathon project showed the basic features of RIPE Atlas and what it can accomplish. RIPE Atlas also maintains a parsing library named Sagan, available in GitHub, that handles format changes in measurement results and always returns a native Python object.
RIPE Atlas has a huge amount of functionality and can be easily used in your own experiments and measurements. Remember to always use the RIPE Atlas infrastructure responsibly (see also Ethics of RIPE Atlas Measurements).
Another tool for using permanent measurements, streaming data and building dashboards is the RIPE Prometheus Exporter which is working as a metric exporter of RIPE Atlas measurement results that exports collected metrics to Prometheus. Grafana is a common tool that works well with Prometheus to create dashboards with useful metrics, gathered from RIPE Atlas measurements.
Comments? Questions? Other ways to use RIPE Atlas and receive measurements? I’d love to hear your feedback!
This was originally published on Leaseweb Labs.
Comments 0
The comments section is closed for articles published more than a year ago. If you'd like to inform us of any issues, please contact us.