
In this article we explain how we used RIPE Atlas to evaluate new synaix's peering partners within an Internet Exchange Point and how this helped to improve our customer services.
In order to help synaix's customers improve the reachability and performance of their services, we peer at DE-CIX Internet Exchange Point in Frankfurt. This brings our customers' and their partners' networks closer together.
Internet Exchange Points (IXPs) help shorten the path between networks and therefore the services provided over these networks. The main benefits of an open peering policy within an IXP include:
- Increasing diversity
- Managing bandwidth by balancing traffic
- Reducing latency
In some cases, latency might be a better measure for "speed" than bandwidth.
Although the overall health and quality of IXPs is quite good, being directly interconnected via an exchange point is sometimes not the best solution, because organisations apply different routing and oversubscription policies on their links. Different applications have different requirements, and the same is true for the peering that transports the data.
Measurement Setup
The first step in evaluating the quality of a peering session is to measure the actual traffic that is flowing between the two AS Numbers. In our case, we use the sflow collector from pmacct in combination with the monitoring tool Zabbix.
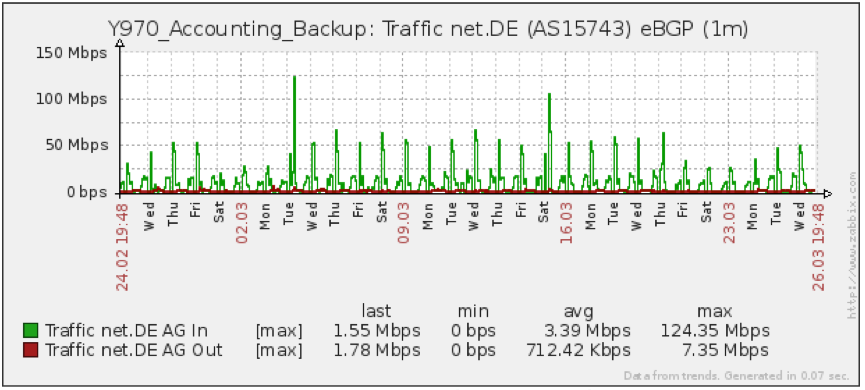
In the examples below, we show some measurements done to one of our peering partners at DE-CIX (Frankfurt): net.de (AS15743). In Figure 1 you can see the traffic pattern between our network and net.de.

Figure 1: Traffic between AS24582 and AS15743
The second step, in evaluating a peering session, is to conduct a test and evaluate the end-to-end latency. We used RIPE Atlas to evaluate the data. The evaluation was done in two steps:
- First, we performed a RIPE Atlas user-defined measurement traceroute to evaluate the current path between the two ASes, followed by an evaluation of the latency between the two ASes (Measurement 1).
- In the second step, we brought into service the BGP peering and re-evaluated the first step (Measurement 2).
Since the load of the links varies over time (day/night, week/weekend), the latency on the link can also vary. Therefore, we measured the latency over a certain period of time. Figure 2 shows a simplified version of the network layout we used to do the measurements.
- Measurement 1: synaix - Upstreams - net.de
- Measurement 2: synaix - IXP - net.de

Figure 2: Test network layout
Measurement Results
To perform the measurements we wanted, we needed to extract the route advertisement information from AS15743 (as-set) from the RIPE Database (see Figure 3) and note the results.

Figure 3: RIPE Database search
After that, we went to RIPE Atlas and configured the traceroute and ping measurements. As the origin, we used the information we found in the RIPE Database and luckily we had a match: network 193.99.145.0/24 (see Figure 4 below).

Figure 4: RIPE Atlas user-defined measurement
The first traceroute test (Measurement 1) showed a very acceptable latency value of 15.801ms and 13 hops (AS24582, AS8422 and AS15743). The second test (Measurement 2) showed a latency value of 14.462 ms and 10 hops (AS24582, AS15743). See Figure 5 below for the full results. So at this point, we could conclude that the overall performance had improved slightly.

Figure 5: Traceroute results for first and second measurements
As mentioned above, we wanted to focus on a period of time and not a specific point in time. We used Zabbix to log and graph our RIPE Atlas ping measurements.
Zabbix: A Distributed Monitoring Solution
Based on community contributions on the RIPE Atlas GitHub account, we wrote a Python script to retrieve our user-defined measurements and visualise them in Zabbix.
Zabbix works in combination with the script using Status Checks. The script accepts two fields: one measurement ID (e.g. #1598026), and one or more probe IDs (e.g. #435). On the zabbix_agentd.conf file, under UserParameter, we configured which script Zabbix would use for that purpose:
UserParameter=idmp[*],python /path-to-the-script/idmp.py $1 $2Additionally, we needed to configure a host and a graph in Zabbix to push the script and graph the results. On the host screen, we specified on the Key field which script to call (idmp[MeasurementID,ProbeID]). As the update interval we specified 300 seconds. Figure 6 shows the Zabbix host configuration screen.

Figure 6: Zabbix host screen
The graph is configured by adding the mentioned items (see Figure 7).

Figure 7: Zabbix graph screen
The Resulting Graph
Figure 8 shows the entire measurement spread over a three-day period.

Figure 8: Complete Zabbix measurement
We realised that the trend of the punctual measurements (the blue side of the graph above) did not show the same performance as the three-day period measurement (outlined in green). Directly after the initialisation of the BGP peering (the red arrow pointing to 24.03.2014 9:30), the latency's slope slightly increased and the value increased to around 1 ms. That peering point is highlighted in Figure 9.

Figure 9: Peering point of inflection
Conclusion
The process described above shows how some simple measurements can help evaluate the quality of peering between networks. It also highlighted latency variability in the time of day/week. This process could be used by a variety of businesses and organisations to help identify and diagnose their own potential connectivity problems and find peering solutions that work best for them.
Daniel Gomez is a network systems engineer at synaix IT GmbH, a company offering IT-based products and services to businesses to facilitate Digital Business Transformation. This article was originally published on the synaix blog.
Comments 4
The comments section is closed for articles published more than a year ago. If you'd like to inform us of any issues, please contact us.
andrea consadori •
hi, the script url is broken, can you fix it?
Mirjam Kühne •
Andrea, the link to the RIPE Atlas GitHub account has been fixed. Is this what you meant? Thanks for pointing this out.
andrea consadori •
Now the github link is working
Andrea Consadori •
if can help i obtain the same result without any script and installing jq on zabbix server, this is my useragent in zabbix_agent.conf UserParameter=RipeAtlasLatency[*], curl -sS https://atlas.ripe.net/api/v1/status-checks/$1/ | jq '.probes["$2"] .last' $1 is the measurement ID and $2 is the probe IDs