
We're looking at user-to-user connections, based on RIPE Atlas measurements and ISP's end-user market share estimates provided by the APNIC.
Introduction
Most of the traffic volume on the Internet nowadays is believed to be users fetching content from one of the big content networks. If you add in content delivery networks (CDNs) and video distribution, then you have the majority of traffic volume that users generate covered. It makes sense for operators of both the users' ISP and the content providers to spend their working days on optimising these traffic streams.
But are there important types of traffic that are not covered by this user-to-content pattern? What about direct user-to-user traffic? There are a number of technologies that rely on peer-to-peer, server-less connections. To gain insight into this, we developed a new visualisation to sketch the user-to-user connection eco-system in a country, showing the parties involved.
Motivation
These direct user-to-user connections have a number of interesting properties:
- User-to-user connections are the type of connections that involve, in theory, the fewest parties. At present, much of the communication passing between end users goes via social media platforms, who relay the relevant content, and see, at a minimum, the relevant meta-data. Direct user-to-user connections are those connections that don’t involve any such mediation, i.e. they happen directly between users at the IP layer. WebRTC is an example of an upcoming technology that uses these direct connections. While NAT traversal used to be a problem for this type of technology, it would appear as if that problem has largely been solved.
- Content can be moved and cached as close as possible to the user, to optimise for bandwidth and latency. In the case of user-to-user connectivity, however, a network operator can't move the users closer. The network operator of a user-heavy network can try to optimise the paths between users by using direct interconnections (PNI or via an IXP) to other networks that are user-heavy.
These properties make this type of connections interesting to look at, even more so because they are not the typical heavy traffic flows that tend to be optimised for first.
Methodology
We built a prototype to explore user-to-user connectivity, based on the following ingredients:
- RIPE Atlas traceroute measurements, specifically those used for the IXP Country Jedi
- APNIC data that estimates which networks in a given country have significant numbers of end-users. This is further described on the APNIC website.
We’ve restricted the prototype to displaying data only for networks with more than 1% of a country’s Internet user population (based on APNIC's data). We then measure the path between them (based on the RIPE Atlas probes located in those networks) and infer if these networks are directly connected or if there are transit networks and/or IXPs in the path between them. With this information we create visualisations of the user-to-user Internet per country. A more detailed description of the methodology can be found in footnote [1].
We deliberately call these prototypes sketches because, while generally showing relevant networks that facilitate user-to-user interconnectivity for a given country, the underlying data and methodology can contain inaccuracies. Creating these sketches allows us to uncover these inaccuracies.
Visualisation
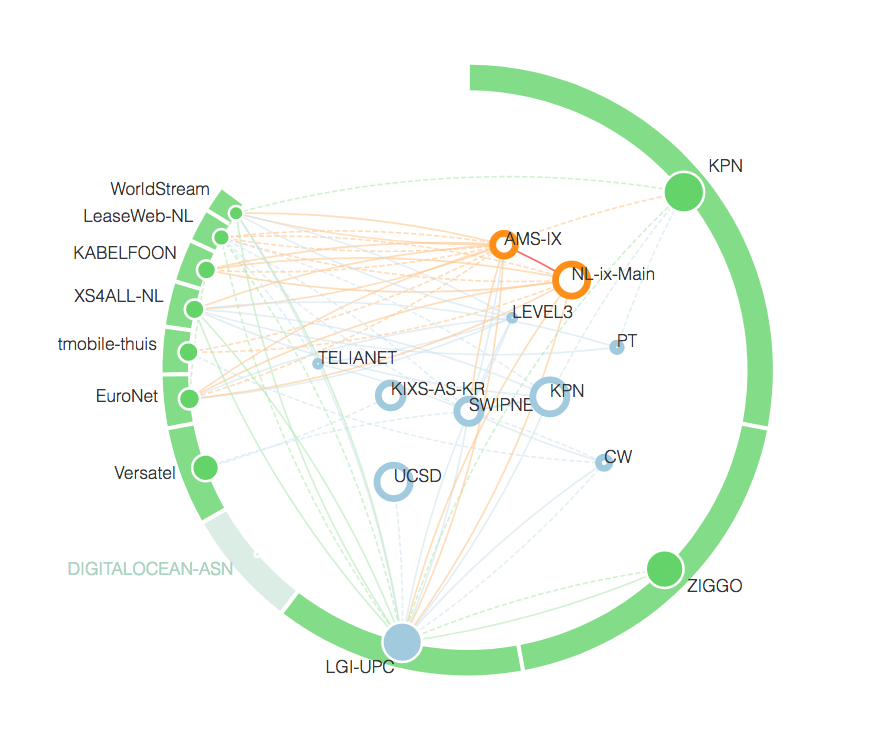
In Figure 1 below we describe all the components of this visualisation.
For more details on the legend of the visualisation go to the IXP Country Jedi page and click "expand" next to the legend.
Example visualisations
Below you will see examples of some countries that show interesting features:
The first example is South Korea, where you can see that a few large parties handle most user-to-user connections and they interconnect directly, with no other networks involved.
South Korea:

In the second example, the Czech Republic, we see that there are many smaller parties that have users, and larger variety of intermediary networks to facilitate the connections between these users.
Czech Republic:
Next steps
From conversations with people active in various local network operators groups we received the feedback that this is interesting. From this we built confidence that these sketches show what part of a local Internet interconnect eco-system facilitates direct IP connections between users, even if they are not familiar with the local peering coordinators and others that work on making internet interconnect happen. Since the visualisation does not represent traffic volume, we noticed that it's easy to misinterpret the visualisation, especially when high volume networks are missing.
Apart from trying to show relations between local players with regards to user-to-user connections, we're also exploring this visualisation as a basis for other, similar analyses of interconnect eco-systems.
We invite those who are interested in these types of visualisations to explore the the user-to-user measurements of the countries they are interested in here:
https://sg-pub.ripe.net/ixp-country-jedi/
Footnotes
[1] For this visualisation we use the IXP-country-jedi mesh-traceroute measurements for a given country in a given month. (code: https://github.com/emileaben/ixp-country-jedi/ ). From this data we extract only the traceroutes that have source and destination ASNs that have significant user populations (according to APNIC population data). We map all IPs in the traceroutes to IXPs (according to PeeringDB peeringLANs), and ASNs (according to origin ASNs for IP space as seen in RIS). For all entities (IXPs and ASNs) we give a calculation of the number of paths that pass through them. As this footnote only provides a dense description of how this works, it is advisable to either look in the ixp-country-jedi code or look at this presentation for more details on how this works.
Comments 0
The comments section is closed for articles published more than a year ago. If you'd like to inform us of any issues, please contact us.