This is a report about APNIC participating in the Day In the Life data collection activities organized by OARC and CAIDA.
(This has originally been published on http://icons.apnic.net )
APNIC participates in the Day In the Life data collection activities organized by OARC and CAIDA . This activity provides us with full-day full-packet capture of our public DNS servers located in Brisbane, Hong Kong and Tokyo. These DNS servers provide the in-addr.arpa and ip6.arpa 'reverse DNS' delegation points for the Asia-Pacific Internet address resources, but also provide secondary DNS services for the reverse-DNS delegations in Europe, Africa and Latin America (on behalf of RIPE NCC, AfriNIC and LacNIC).
The most recent data collection was March/April 2009.
1) IP addresses used by queriers 2008-2009
Initially, we expected to see a very high percentage of IP addresses which queried our servers coming back, year on year. This is because reverse-DNS is often characterized as 'infrastructure' DNS, performed by stable servers, resolvers, deployed services in the global network, and these do not typically have variant IP addressing. To be a server, you typically have both a static IP address assigned, and a name-to-address mapping in forward DNS which is then published to clients, as a URL or in configuration for a local subnet.
But, the evidence we see from comparing DITL 2008 and 2009 is that in fact only about 1/3 of addresses seen in 2008 re-present in 2009. This is far more variability than we expected.
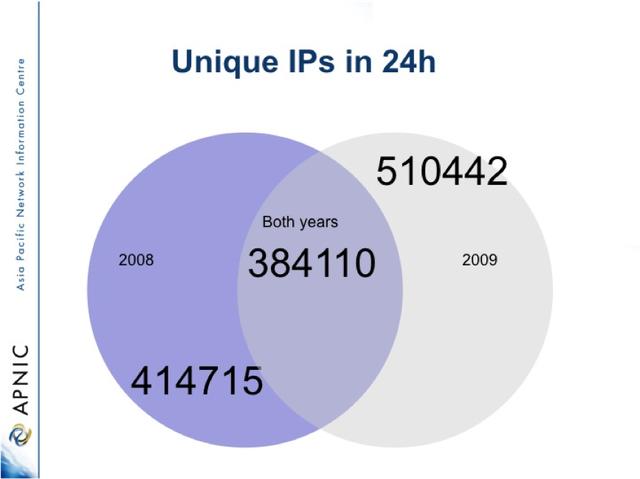
We expect to re-examine this in DITL 2010 (in planning) and review if there is a year-on-year trend in querier addresses seen.
2) Queries per IP address seen
For the IP addresses which query us, we expected to see that most addresses persistently queried us for a lot of reverse-DNS. The argument was that since this is 'infrastructure' DNS, and since the resolver in question (the IPs which we see are resolvers deployed in the global internet) is forwarding reverse-DNS queries in our number space, it very probably will do this for a lot of queries. Some server must be processing logs, analysing traffic or otherwise requesting the data and these tend to be done in big 'lumps'.
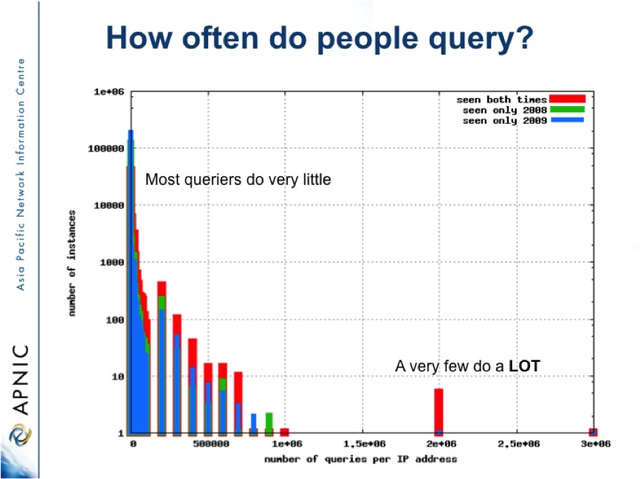
Again, this is not what we actually find when we analyse the data. In fact, the vast majority of querier IP addresses do very few PTR lookups, of the order one or two, or a few. Only a very small number of IP addresses do a significant volume, and less than ten do millions of queries.
3) Tunnelled IPv6 and IPv6 usage is being seen
APNIC has been categorizing the source IP address by address type in 5 categories:
- IPv4 Addresses
- True IPv6 Addresses, directed delegated under address management process
- Tunnelled IPv6 sub-categorized as follows:
- Teredo
- 6 to 4
- '6rd' (a form of localized 6to4/teredo deployment inside an ISP)
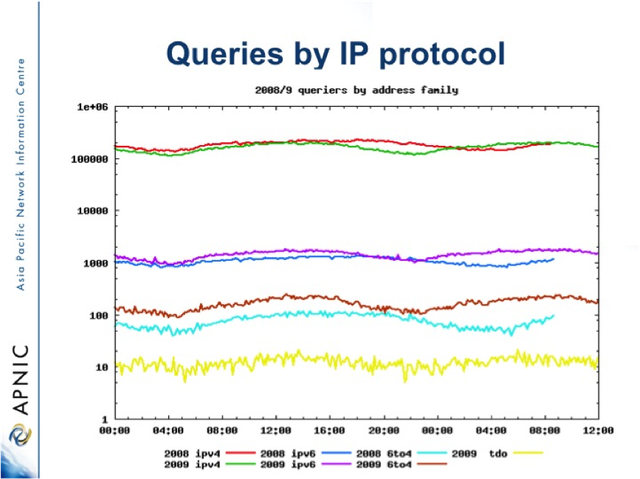
The breakdowns of IP address types seen at the APNIC DNS servers offers an insight into the relative usage of each type of IP in the deployed internet. It is noticable that the ratio of IPv4 to IPv6 is of the order 2 decimal orders of magnitude. However there has been some increase in IPv6 in 2009 over 2008, both natively and as 6to4 tunnel. Interestingly, the tunneled IPv6 appears to be persistent, and may reflect improving RTT and service levels in the global Internet.
4) Regional variations reflect local timezone
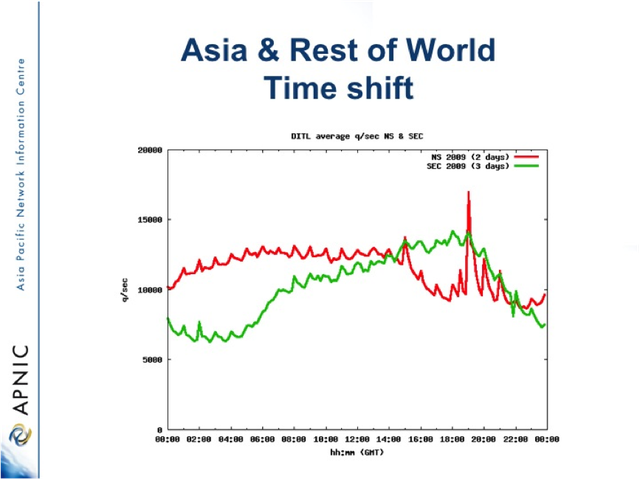
There are good reasons to believe that the DNS query load we see is strongly affected by the timezone of the querying system. This slide shows the comparison of queries for Asia-Pacfic IP addresses, compared to the rest of the world. A quite different dynamic, and peak load can be seen. This appears to confirm that human-centric processes, be they scheduled logfile processing or end-user load do influence reverse-DNS. (in the slide below, NS is the service which predominantly services the Asia-Pacific Internet Address ranges, while SEC is the DNS service which secondaries Africa, Europe and Latin America).
5) World region breakdowns on traffic
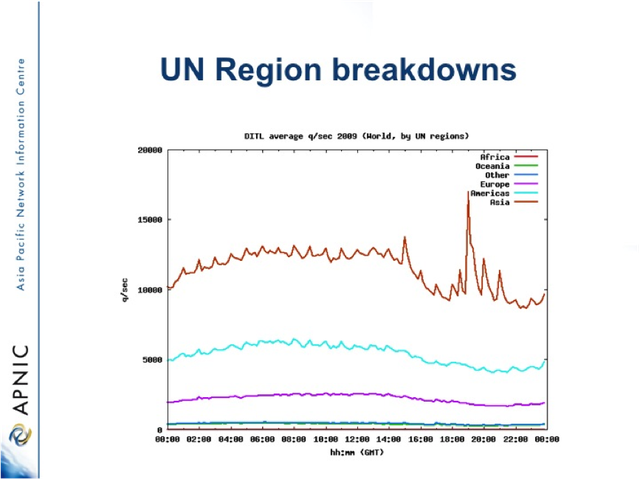
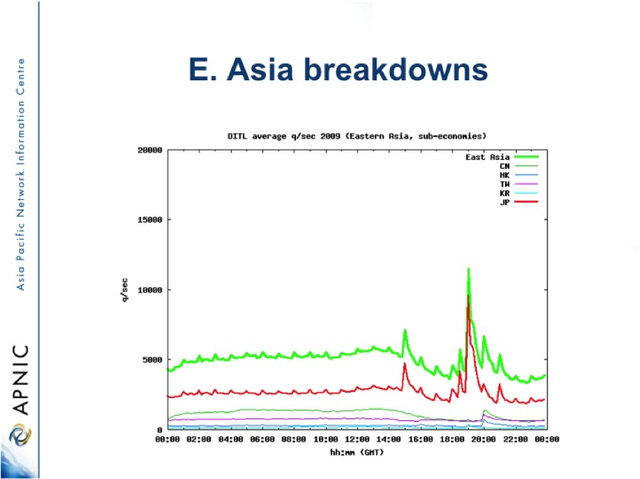
If the source Query addresses are sorted and collated by the UN regions, interesting differences in the dynamics of DNS can be seen. In particular, a very strong signal of an Asian-region specific activity comes out. This turns out to be a Japanese specific DNS query pattern, which is very probably a systematic check of reverse DNS or some other 'tree walk'.
First the UN regional breakdown on query IP:
Then further analysing the "Asia" Category, into East Asia by economy we find:



Comments 0
The comments section is closed for articles published more than a year ago. If you'd like to inform us of any issues, please contact us.