With fewer attendees and fewer hot topics to vote on, autumn General Meetings seldom match the warmth and energy of their spring counterparts. But despite the season, GMs are always an impactful way to participate in the RIPE NCC's decision making process. We take a quick look at our October GM numbers and analyse turnout graph by graph.
This article builds on our earlier analysis of GM voter make-up in May. We hope that sharing these articles will help to develop a clear record of how our membership and participation in the RIPE NCC decision making process is evolving over time.
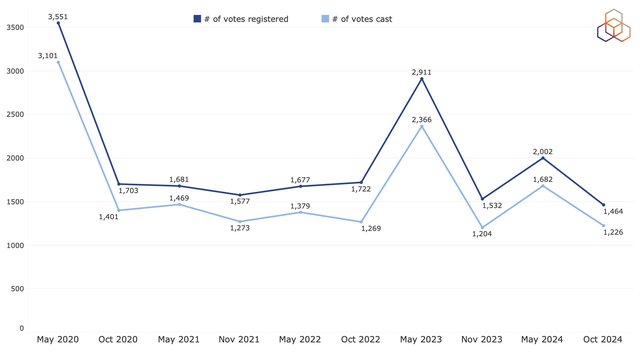
1,464 members registered to vote at this GM and 1,226 of them cast their votes on a single resolution to redistribute the excess from 2024. The members that cast their votes represented a 6.2% turnout among eligible voters.
The below graph shows how the number of registered and cast votes changed over the last 10 GMs. It confirms that spring GMs have received more attention over the last five years, sometimes quite a lot more. But apart from the seasonality, there’s not much change in the number of votes from a year ago and this GM’s numbers are as expected. The first GM on the graph might seem to indicate a decline in participation, but remember that May 2020 and May 2023 were exceptional GMs with their high turnout and topics.

Country participation
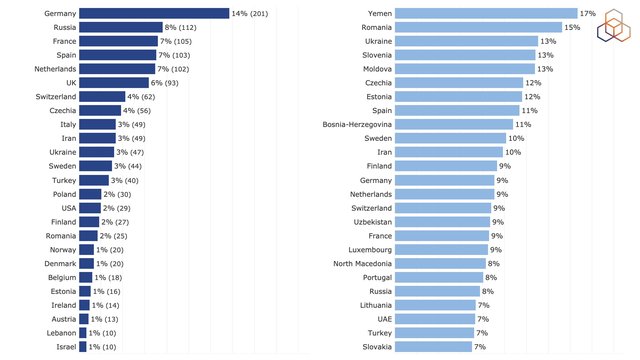
The total numbers are stable, but who are the members that make up that total of 1,464 voters? One useful piece of information you can find on our website after each GM is a breakdown of voting turnout per country. Here’s a visualisation with countries with the highest turnouts listed alongside.

Country turnouts might seem low, especially if you’re comparing these numbers to the May 2024 GM, but this is in line with the lower overall participation. It’s perhaps healthier to compare each country’s share of votes in this GM to their share in the previous one.
Let’s take Czechia as an example, it being the host country for RIPE 89. Czech members traditionally have above average turnout. They made 4% of the registered votes in this GM, which is not a significant increase compared to the previous GMs.
Spain is an outlier, increasing turnout since the last GM. It comes fourth for voting registrations, having more impact than countries with far more active members, such as the Netherlands and the UK.
Generations of voters
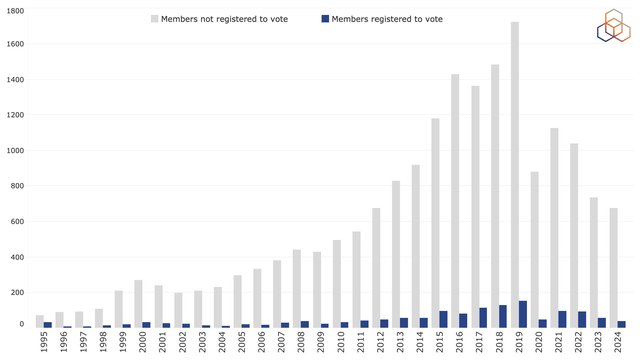
The year that a member joined the RIPE NCC indicates just as much about them as where they are from, if not more. Younger and older members have experienced different policies and challenges, and probably had different motivations to become a member in the first place. The below graph shows the members joining each year, with the members not registering (grey) and registering (blue) stacked separately.

As there are far more younger than older members, we’d expect to see this reflected in the voter make-up. But considering the share of members from 2015-2024 in the membership, their share in the voting membership is low. The fewer older members are more interested in participating in the GM compared to the many young members we have. Despite this contrast, this is an expected graph, being very similar to the ones from previous GMs.
Voter resources
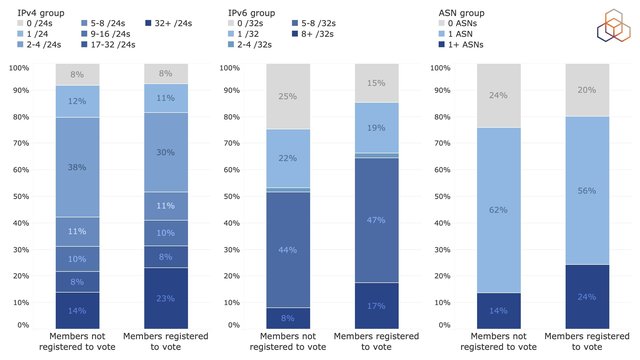
We looked at the voters from different countries and years, but the most practical aspect to group members on might be the amount of resources they hold. In the graphs below, members are grouped by amount of allocated IPv4, allocated IPv6 and ASNs they hold respectively from left to right. In terms of all three types of resources, voters tend to hold more than non-voters. This is not independent from their ages, since older members are more likely to hold more resources.

Consistent participation
These graphs on voter make-up are not surprising as they are similar to ones from the previous GM. The demographics of voters are steady due to mostly consistent participation. After all, 71% of the members that registered to vote on this GM had also registered to vote in May. Voters vote!
This consistency indicates that a committed part of our membership values their voice in decision making and comes back to vote again. However, we hope to see greater participation from newer members. In this GM, 41 (about 3%) of the registered voters were eligible to vote for the first time, and they exercised their rights to do so. With contributions from newer and older members alike, the participation in the October 2024 GM aligns with trends from previous GMs. We look forward to seeing more voters and welcoming new voters in May.


Comments 0
The comments section is closed for articles published more than a year ago. If you'd like to inform us of any issues, please contact us.