Turnout at the October 2025 GM hit a decade low - but did the lower numbers reveal a core of dedicated voters? We take a closer look at the distribution of dedicated versus casual voters over the past six GMs, sharing observations on what resources they hold and showing how influence shifts when casual voters stay home.
Six months ago, we dove deep into the low turnout of voters at the May 2025 GM and contemplated the reasons behind it. A month ago in Bucharest, we had an even lower turnout at the October 2025 GM.
The reasons behind the low turnout, which we analysed at length last time, haven’t changed all that much since May. In short, there wasn’t much to vote on in both cases. But rather than write another article on low turnout, we thought we would use this opportunity to have a closer look at the dedicated group of members who did register to vote at this GM. We tend to compare voters and non-voters, but perhaps there's a further distinction to be made between dedicated and casual voters.
So in this article, we're going to have a look at the usual turnout stats, but we'll also try to distinguish the dedicated voters who might have revealed themselves in this GM.
Turnout overview
Out of 19,665 eligible members, 1,004 registered to vote and 801 cast their votes, resulting in a 4.1% turnout. With these numbers, the October 2025 GM becomes the GM with the lowest number of registrations and cast votes since October 2016, and the lowest turnout over at least the past decade.
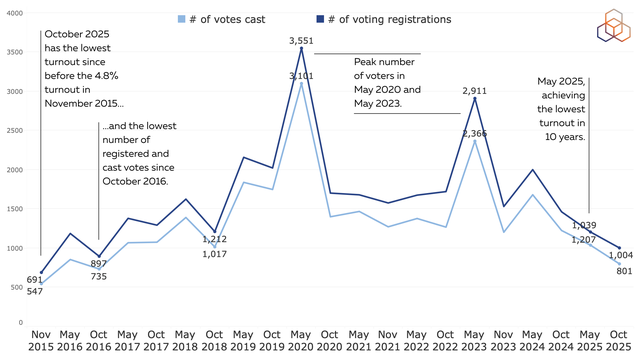
Having said that, it’s not surprising to see an Autumn GM with low turnout. The hottest topics to be voted on - Charging Scheme and Executive Board election - both happen at May GMs, leaving Autumn GMs with just the annual vote on the redistribution of the excess contribution. This vote tends to be a foregone conclusion (further confirmed with the 93% approval rate at this GM) and does not elicit controversy.
Country-level participation is also not surprising, with the usual suspects and the host country contributing relatively more.
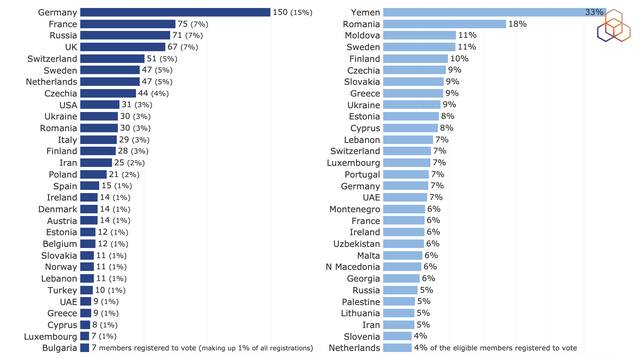
Germany, France, Russia and the UK are once again the biggest contributors to the voting mix. Their turnout is consistent with the overall turnout over the GMs, which is undoubtedly due to the size of their membership allowing for a reflective sample. The Netherlands is missing in this group with their turnout having dropped to 4% - a record low turnout for them since May 2015.
The host country Romania consistently has around twice the average turnout at the GMs. The decreasing turnout in the last two GMs were reversed in this GM and reached 18%, which is an incredible number for a country of its size having 163 eligible members.
Greece makes a comeback with a turnout of 9% after a dip last October, which seems to have gradually recovered. They have been somewhat absent in the last two GMs, but they are back at their regular level with a GM physically held in a fellow SEE country.
Did this GM reveal the dedicated voters?
The usual breakdowns aside, we are curious whether this GM - given its especially low turnout - revealed a dedicated group of members that don’t miss a GM.
To answer that question, let’s focus on the last three years. Looking at members who registered to vote in at least one of the six GMs that took place in that time, we see some that only did so once, some that registered for two or more, and some that registered for all six GMs. Grouping members depending on just how many times they show up as registered voters across these GMs, we thought we might then be able look more closely at the potentially changing influence of casual vs dedicated voters.
The graph below illustrates this breakdown of members who registered to vote in at least one of the last six GMs. Of those members, 400 registered to vote in all six GMs, making up the steady purple base of each column. These are our dedicated voters. Also for each column, the lightest blue group at the top comprises the one-timers - the members who showed up to vote at that, and only that, particular GM. Adding those up, we see that a total of 1,932 members only registered for one of these six GMs.
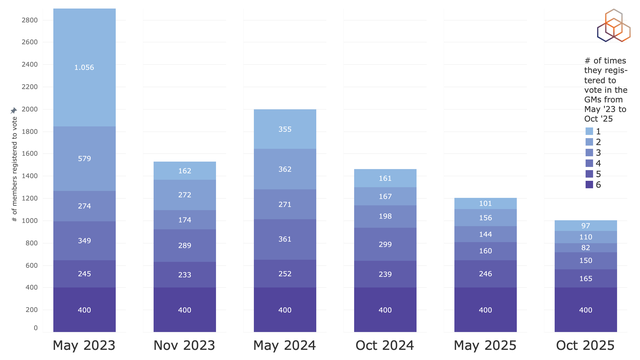
The shrinking of the columns as we go to the right of the plot - indicative of the downturn in participation we’ve reported on for recent GMs - is contrasted by the high turnout we saw in May 2023. The breakdown clearly shows that that particular GM stands tall, largely thanks to the 1,059 members who haven’t participated in a single GM since. High interest from casual voters drives high-turnout GMs!
As we move to the lesser-attended GMs, we see fewer and fewer casual voters, which increases the influence of the dedicated voters. The influence of the same 400 members in each GM is very different in a high-turnout vs a low-turnout GM, and it heavily depends on overall participation. For comparison, members who voted at least four times (bottom three stacks) in the last three years make 34% of the registered votes in May 2023, and 71% of the registered votes in October 2025.
Are they different?
Their influence aside, are there demographic distinctions between dedicated vs casual voters? Despite never letting go of country-level stats, the most indicative distinctions always come from how resourceful each group is. Our previous analyses on voters vs non-voters consistently revealed voters to have more resources than non-voters. Is that the case for dedicated vs casual voters as well?
Let’s take all the members from the previous graph and rearrange them. Below are three bars representing the 4,214 members that have registered at any of the last six GMs from May 2023 to October 2025, the total amount of allocated IPv4 addresses and the total amount of allocated IPv6 addresses they collectively hold, from left to right. Each bar is divided by our voter groups showing the share each 1-to-6 group has among the voters, allocated IPv4s, and allocated IPv6s, from left to right.
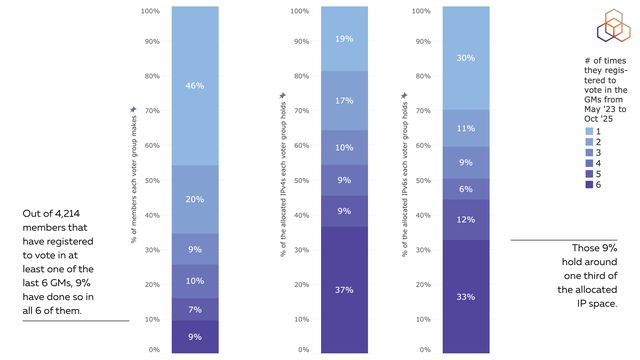
There is a clear disproportion between these bars. The 400 “all-time” voters make 9% of the voting members, hold 37% of the allocated IPv4s, and 33% of the allocated IPv6s collectively held by this group. On the other end of the bars, it’s the one-time voters whose share of allocated IPv4s and IPv6s are the smallest compared to how much of the members they make up.
However, in any statistical analysis, one needs to factor in the power of outliers - especially when working with a sample like ours where one member holds 32,000 times the allocated IPv4s the median member holds. Let’s draw the line at 128 allocated IPv4 /24s and 128 allocated IPv6 /32s, and exclude the members that hold more than either limit. They make 460 of the 4,214 members that have registered to vote at least once in the last three years, leaving us with 3,754 members. Below are the updated bars when these outliers are excluded.
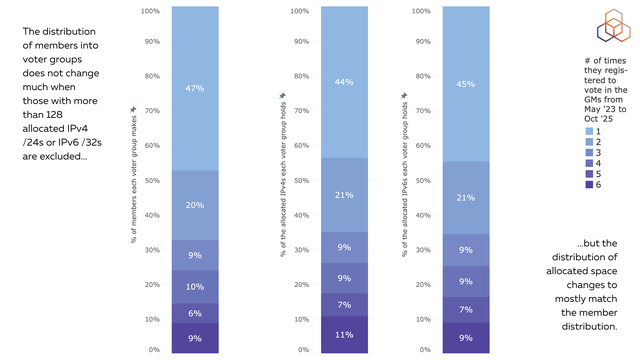
The remaining 89% of the members in our sample suggest there is no significant distinction among dedicated vs casual voters in terms of how much resources they hold.
Another approach to eliminating the impact of the outliers is to put the members into bins of different amounts of resources instead of summing it all up. Below are the distributions of our six voter groups across IPv4 and IPv6 resource bins.
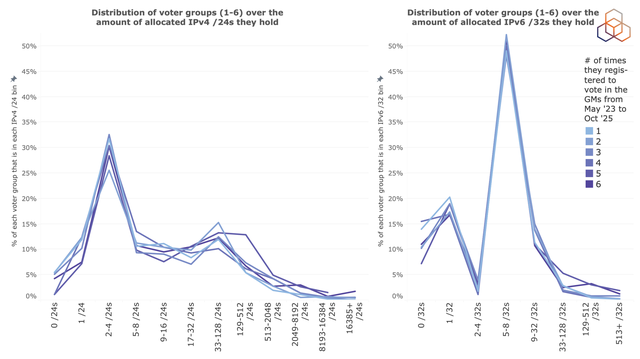
All the six lines in both graphs seem to roughly coincide, reinforcing our conclusion that there is no significant distinction between dedicated vs casual voters in terms of the amount of resources they hold.
However, if we look closely, we see that the darker lines of 5 or 6 time voters are slightly higher in the highest resource groups of the allocated IPv4 and IPv6 resource bins. That slight difference creates a big disproportion in the bars above, because it includes a few great outliers. But the outliers don't define the group.
Given the aligning lines in the above graphs, the dedicated voters are not necessarily more likely to have great amounts of resources. Considering the outliers favouring the “all-time” voters, the voting members with very large amounts of resources are likely to show up at every single GM.
Are the most resourceful members more invested?
Having spotted members with particularly high numbers of resources in the voting mix, one question we’re led to ask is whether such members are highly involved at GMs? Let’s close in on the highest resource holders and see.
Among the top 100 allocated IPv4 holders, 33 registered to vote at the last GM, and 16 registered to vote at all of the last six GMs. Those numbers go to 32 and 20, respectively, when we look at the top 100 allocated IPv6 holders. This is higher than overall participation, which hovers around 5-10%. So while not all high-volume resource holders participate, as a group they seem on the whole to have more interest in the GMs.
We might view this as the most powerful among us being omnipresent. But another way to look at it is that these big companies have enough resources to sponsor a few of their employees to consistently participate in and contribute to the RIPE community. Who do we attribute this interest to anyway - the big company that is the member of the RIPE NCC or the individual who is an active participant in the RIPE community?
See you next time
Regardless of which members voted, this GM was voted on by fewer members. It was also the shortest running GM since the return of in-person GMs post-COVID lockdowns, tied with the October 2022 GM in Belgrade. For a short-running, low-turnout GM, there is not much to say on the reasons behind the low turnout beyond the simple fact that there wasn’t much to vote on.
As a result of the low stakes, we got to observe the dedicated voters and their influence over the decisions when there is not wider participation. Having a dedicated group of members consistently following our governance processes is just as important as having fresh blood and new perspectives in the mix. And their influence is greatly dependent on the participation from across the membership.
With the Charging Scheme and Executive Board elections coming up, we expect (and encourage!) a higher participation in May, and we look forward to analysing turnout afterwards.


Comments 0