
We wanted to find out what network security experts think about network anomalies. We created a short web survey in order to map opinions of network professionals. In this article we describe the results.
The survey focused on the following key aspects:
-
What is the definition of an anomaly?
-
What tools are you using for monitoring?
-
What is a suitable number anomalies you would report?
-
What outliers (such as peaks or vallues in monitoring charts) are considered to be an anomaly and what is the severity of such an anomaly
Question 4, and maybe the most important one, consisted of labeling points in the charts displayed in the survey. The charts depicted time series of various network statistics (flows, packets, bytes) of four networks of various size and type. After marking the point the respondents were asked to rate the severity of the anomaly using 3 levels.
The survey was sent to operators mailing lists (SWINOG, DENOG, NANOG and DE-CIX), presented durig the 40 th TF-CSIRT meeting and was also promoted here on RIPE Labs . In order to get representative results, it was important to reach out to the relevant groups and to obtain a sufficient number of responds.

In total 42 respondents finished the survey. While we were hoping for a larger number of respondents, we seemed to have reached the right target group: over 80% of the respondents considered themselves to be experts or “almost experts” in the field of network security. Only 2 respondents rated themselves as rookies. Almost half of the respondents indicated that they work for a CSIRT or a CERT or for an academic institution. About the same number came from commercial companies.
The respondents were also asked to identify the monitoring tools used in their organisation. As you can see in Figure 2 below, the majority uses some form of flow monitoring, log analysis or handwritten scripts.

The main goal of the anomaly survey was to learn, how is the term network anomal y is understood by the network security community. The results will help us to develop a better tool for time series analysis . The participants were asked to describe their own definition of network anomaly. Generally, the definitions were similar, many of them used nouns such as behaviour or pattern further specified by adjectives such as normal, different, unexpected or unusual . The minor differences between definitions were likely caused by the different backgrounds of individual respondents. Based on these definitions we were able to distill information, that was not obvious at the first sight:
-
The definition of anomaly “depends very much on maturity of the security culture” in an organisation.
-
In the scientific definitions of anomaly, the world “unusual” may have to be replaced by “u n predictable”.
-
It is not just about detecting an anomaly, “ another issue is to connect a certain severity to the detected events to get the alerts prioritised” .

When asked for the number of anomalies the respondents would report, the majority indicated that a part-time incident handler should have to handle less than 10 anomalies per day. For full-time incident handlers there were two major responses: approximately one half of respondents would report less than 10 anomalies per day. The other half would agree to report 20-50 anomalies per day. These two answers could be caused by the difference in the assumed severity of an anomaly and the presumed time required to analyse them.

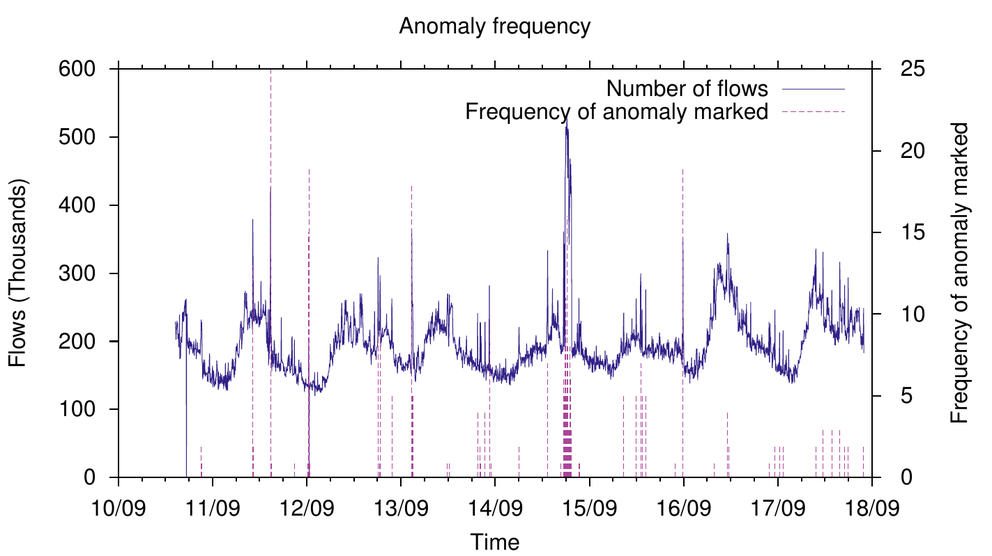
Lastly, the respondents were asked to mark anomalies on the charts displayed in the survey. The charts depicted time series of various network statistics (flows, packets, bytes) of four networks of various size and type. After marking that point, the respondents were asked to rate the severity of the anomaly using 3 levels.
Although in general the definitions of an anomaly were very similar, there wasn't a clear consensus about what is seen as an anomaly on those charts. Only distinct anomalies were marked by the majority of respondents. In Figure 4 above we can see two large anomalies: the afternoon of 11/09 and the night of 14/09 were marked by the highest number of respondents as an anomaly. However, besides these obvious anomalies, there were many anomalies, that would have been reported only by 5 or less respondents. The number of marked anomalies per day fluctuated around 6, which is consistent with the adequate number of reported anomalies drawn from previous discussions.
Conclusion
There is general consensus on how the term network anomaly is defined. Also in the practical exercise in marking anomalies, the respondents marked similar anomalies. The abnormality level of the anomaly seems to determine if it is seen as an anomaly or not.
If you have any questions or if you are interested in network anomalies research, you can reach us at csirt-info(at)muni.cz or take a look at the created tool .
Comments 0
The comments section is closed for articles published more than a year ago. If you'd like to inform us of any issues, please contact us.