
The RIPE NCC is 20 years old and it now has over 8,000 members. In this article, we drill down a bit more into the composition of our membership: what industry do RIPE NCC members come from and which countries account for the highest numbers of members and IP resources.
The RIPE NCC became the first Regional Internet Registry in September 1992 (six months after it was set up as the secretariat for the European operators community, RIPE). During the course of 1993, the distributed IP allocation system was established in which Local Internet registries (LIRs) received blocks of IP addresses from the RIPE NCC which were then further assigned to their customers and others who wanted to connect to the Internet.
By the end of 1993, there were 83 LIRs registered as members of the RIPE NCC. Most of these LIRs were operated by academic networks and the first commercial ISPs that started around that time in some European countries.

It is interesting to note that despite the fact that IPv4 is becoming very scarce, we still see a large number of organisations join the RIPE NCC. In fact, in the first quarter of 2012, we saw the highest number of new membership applications ever. In 2011, we experienced the highest growth since the dot com bubble around the year 2000. Also, that the graph only shows the number of LIRs that were active at any point in time. It doesn’t show any of the members who closed in the meantime (if we counted every registry ever opened, we would be looking at a total of over 13,000).
Figure 2 shows the total number of organisations that joined the RIPE NCC per quarter. The yellow bars indicate those LIRs that are still open and active now. The red bars indicate those LIRs that have been opened in a particular quarter but have been closed in the meantime.

In the graphic below, you can see which industry area our members are from. Note that this is a self-chosen category and it is possible to choose more than one category. Organisations that provide the following services are highest on the list: service hosting, collocation and broadband. But Telecom operators, dial-up service providers and transit providers also make up a big portion of the RIPE NCC membership. There are also quite a number of government institutions are members of the RIPE NCC.

Figure 3: RIPE NCC members by industry area
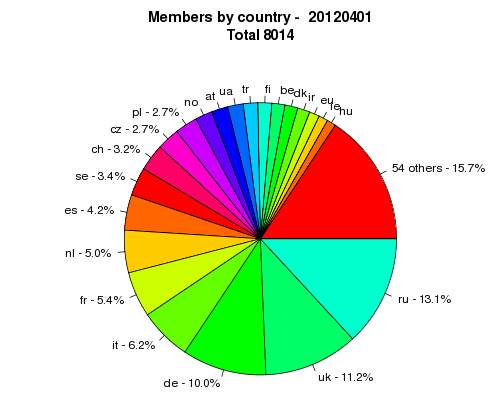
It is also interesting that currently the same six countries account for 50% of the membership, 50% of the number of IPv4 allocations and 50% of the number of IPv6 allocations in the RIPE NCC service region. In the image below you can see that 50% of the RIPE NCC members are located in the following countries: Russia, United Kingdom, Germany, Italy, France and The Netherlands.

In the next image we show the number of IPv4 allocations made to RIPE NCC members by country. You can see that 50% of all allocations have been made to LIRs in the following countries: Russia, United Kingdom, Germany, Italy, The Netherlands and France.

Finally, in Figure 5, we show the number of IPv6 allocations made to RIPE NCC members by country. Again, you can see that 50% of all allocations have been made to LIRs in the following countries: Germany, United Kingdom, Russia, The Netherlands, France and Italy.


Comments 0
The comments section is closed for articles published more than a year ago. If you'd like to inform us of any issues, please contact us.