
This article is based on a lightning talk Matthew Luckie of CAIDA presented at the recent NANOG 54 meeting of work done in conjunction with Amogh Dhamdhere and Bradley Huffaker. The article is structured around a number of hypotheses about the state of IPv6 deployment and the IPv6 capability of networks. In order to verify these hypotheses, the authors looked at various data sets. The full slide set can bee seen on the NANOG 54 web site.
Hypothesis 1:
In nearly all cases, IPv4 and IPv6 AS-level paths should be the same if the network is ‘mature’.
In order to answer this question, we looked at the edit distance between the same AS pairs in IPv4 and IPv6 of a set of dual-stacked route-views peers towards all dual-stacked origin ASes. The edit distance metric is a measure of how many additions, subtractions, and substitutions are required to transform one string into another. In our case, an edit distance of 0 means that the AS path is the same in IPv4 and IPv6.
Our data source consists of seven dual-stacked peers that provide BGP data to routeviews-2 and routeviews-6. This snapshot was obtained on 19 January 2012.

Figure 1: Edit distance of dual-stack AS paths
The image above shows that only two out of seven peers (namely Hurricane Electric and Tinet) see the same AS path (edit distance = 0) for at least 50% of the dual-stack paths.
We assume that IPv6 is ‘maturing’ if the fraction of zero edit distance dual-stack paths increases over time. In the next image, we look at the fraction of dual-stack AS paths that have an edit distance of zero over time, to see if there is evidence of the IPv6 AS ecosystem maturing.

The image in Figure 2 shows that over time the trend is going towards 1 (towards more identical dual-stack paths) which means according to our hypothesis that IPv6 is maturing, but the trend is pretty weak.
Hypothesis 2:
Does IPv6 capability correlate with network business type, bandwidth, geographic region or the fact that the Regional Internet Registries are running out of IPv4?
In order to answer this question, we looked at the PeeringDB . This is a database of self-selected ASes that want to peer. The analysis below is based on a snapshot of 30 January 2012. At that point 2,622 ASes were listed in the PeeringDB of which 60% advertise themselves as "IPv6 capable".

In Figure 3, the green part indicates those networks that claim that they are IPv6 capable. The red part are those networks who say they are not IPv6 capable. You can see that more Network Service Providers (NSPs) than Internet Access Providers (ISPs) say they are IPv6 capable. Content providers show a comparatively low IPv6 capability.

We next examine for correlation between the reported size of the network in terms of traffic volume and the reported IPv6 capability. The graph in Figure 4 shows that the higher the traffic volume of a network is, the more likely the network is to report IPv6 capability.

In Figure 5, we sorted the networks in the Peering DB by region to see if the fact that some RIRs are nearing IPv4 exhaustion has an impact on the IPv6 capability of the networks in this region. However, there seems to be a limited correlation with the estimated date of IPv4 exhaustion at the RIRs. LacNIC for instance is not expected to run out of IPv4 addresses in the near future. But networks in the LacNIC region show a relatively high IPv6 capability. That there is limited correlation can perhaps be explained by the fact that transition to IPv6 is not wholly motivated by the inability to obtain IP addresses from an RIR.
Hypothesis 3:
The profile of business relationships of dual-stacked ASes should be similar in IPv4 and IPv6.
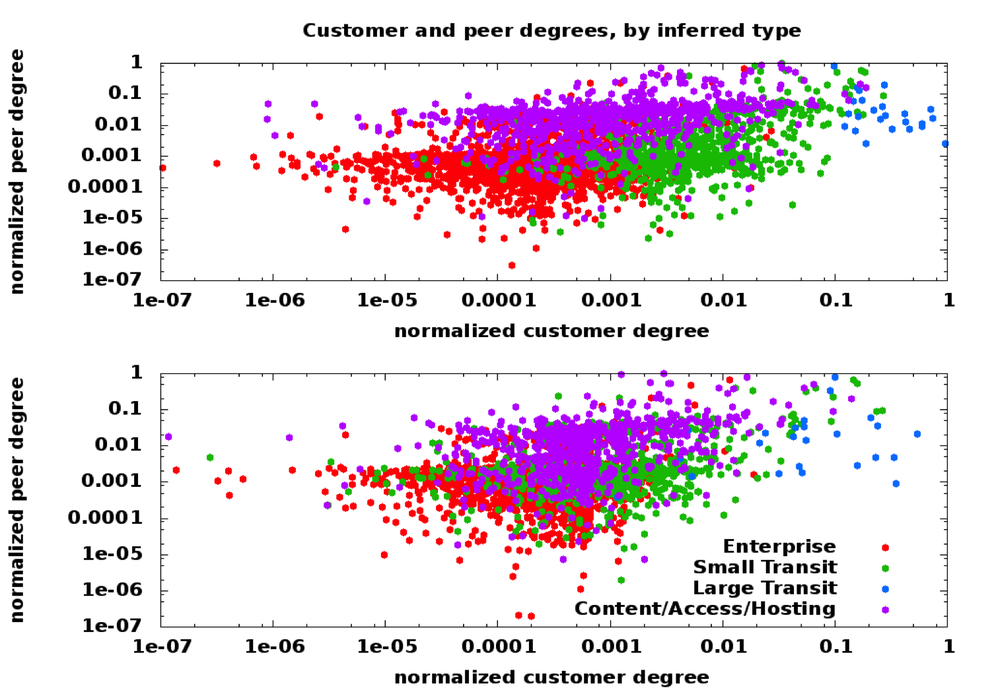
We inferred certain relationships (peer-to-peer and provider-to-customer) in the IPv4 AS-level graph using Gao’s algorithm . We then applied those relationships to the IPv6 graph. For each dual-stacked AS we then inferred the type of the AS (either enterprise, content or transit provider) and then plotted the customer degree against peer degree in IPv4 and IPv6. The degrees on each axis are normalised to the ASes which have the largest customer and peer degrees.

In Figure 6 you can see that, at a high-level, the IPv4 (top) and the IPv6 (bottom) graphs are not that different. From that we conclude that dual-stacked ASes have about the same profile for each protocol.
In the next image we plotted the customer degree against peer degree by AS types separately for IPv4 (depicted by red dots) and IPv6 (depicted by green dots).

The graph at the bottom right of Figure 7 shows that dual-stack transit ASes have a smaller customer degree relative to the degree of the largest AS in IPv6. We suspect this is caused by Hurricane Electric having many more customer links in IPv6 than the other transit providers.
Hypothesis 4:
IPv6 is maturing if the IPv4 and IPv6 round trip times (RTTs) for each AS are similar.
To analyse this hypothesis, we used CAIDA Ark . Archipelago (Ark) is CAIDA's newest active measurement infrastructure which has 20 dual-stacked vantage points (used primarily for traceroute mapping of the Internet). For each vantage point/AS pair, we determined the median RTT value in IPv4 and IPv6 from all traceroute responses. We then checked how different these RTT values are for each AS. On the left side of the graph in Figure 8 (left of 0), the median RTT in IPv4 was lower, on the right side of the graph (right of 0) the median RTT was lower in IPv6.

The vantage points are ordered by the fraction of ASes where the IPv6 RTT was faster than the IPv4 RTT. 16 out of 20 ark machines observed larger IPv6 RTTs to dual-stacked ASes. Because Figure 8 is a dense graph, we plot just the median difference of IPv4 and IPv6 RTTs for each AS in Figure 9. In our data, US-based machines tend to have the best IPv6 RTTs as three of four Ark systems where IPv6 has shorter delay are in the US. From this analysis, we can conclude that the RTTs are in most cases similar in IPv4 and IPv6.

Figure 9: Median difference of IPv4 and IPv6 RTTs to each AS
The full slide set can bee seen on the NANOG54 web site.


Comments 0
The comments section is closed for articles published more than a year ago. If you'd like to inform us of any issues, please contact us.