This is the first part of the IPv6 measurements compilation - a list of IPv6 measurements conducted by various individuals and organisations.
Please also see Part 2 of the IPv6 Measurements Compilation .
The increased deployment of IPv6 that has accompanied the exhaustion of the free IPv4 address pool has encouraged a wide range of organisations and individuals to conduct measurements related to IPv6 data and traffic. These studies range from analyses of IPv6 take-up per country and per organisation, to technical examinations of the performance of IPv6-enabled websites.
We list below the organisations and individuals that produced these studies, including links to their measurements, explanations of their methods and the results of their studies. There is a wide range of statistics and information related to all aspects of IPv6 deployment, so, where possible, we have tried to make connections between related studies. However, we draw no conclusions from the measurements, instead preferring to simply present the results for your own analysis.
What we would like to hear from you are suggestions for further IPv6 measurements or studies that can help you in your operations. How would you chose to measure the growing deployment of IPv6? Have you set criteria for when you will deploy IPv6, e.g. when 25 percent of End Users are IPv6-capable? Let us know what information and analysis would be helpful to assist you in the deployment of IPv6. And would measurements influence your decision to deploy IPv6 or not?
As always, you can let us know what you think by [mailing us at RIPE Labs or leaving a comments in the forum].
Studies:
1. APNIC
2. Comcast
3. Hurricane Electric
4. IPDN
5. Google
6. TNO & GNKS
7. Max.nl
8. Eric Vyncke (Cisco)
9. Tore Anderson (Redpill Linpro)
10. Mark Prior (Juniper Networks)
11. CAIDA
12. RIPE NCC
1. APNIC
Source:
http://www.potaroo.net/presentations/2008-10-13-ipv6-deployment.pdf
Description:
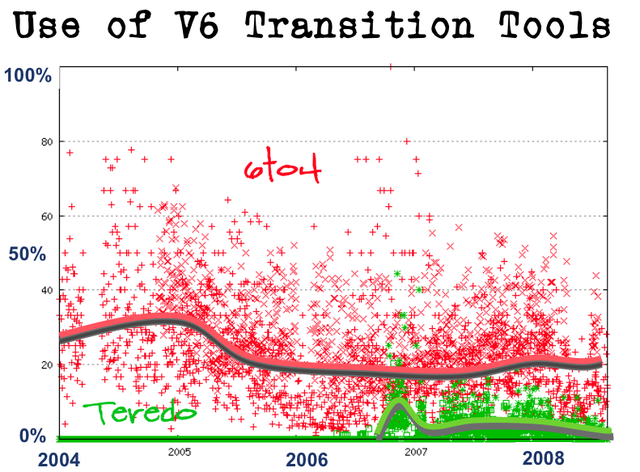
Geoff Huston and George Michaelson from APNIC have been measuring IPv6 deployment by looking at various datasets: BGP routing table, DNS server traffic and web server access.
From BGP data they found 15% of transit AS’s are playing with IPv6 in some fashion, while from web server access logs 0.4% of end-hosts was IPv6 capable. Due to widespread NAT in IPv4 and the fact that the websites that were measured where RIR websites, they estimate that the end-host IPv6 capability was closer to around 0.2% in October 2008.
Source:
http://bgp.potaroo.net/iso3166/v6cc.html
Description:
On this webpage Geoff Huston compares IPv6 allocations and advertisements to country level indicators such as GDP, population and number of Internet users. It shows Australia and the Vatican City leading the way in terms of number of /48 equivalents per Internet user.
More Information:
Geoff Huston also published an article describing the findings:
http://www.potaroo.net/ispcol/2008-04/ipv6.html
2. Comcast
Source:
http://ipv6monitor.comcast.net
http://mnlab-ipv6.seas.upenn.edu
Description:
Comcast together with the University of Pennsylvania measured the size of the IPv6 Internet by looking at the Alexa top one million websites (see http://www.alexa.com ). The tool is looking for A and AAAA records for all the sites listed on Alexa. All those websites were then probed to find out if there is IPv6 content and if the download times for IPv4 and IPv6 content differs. It was found that about 0.15% of these websites were reachable directly via IPv6.
RIPE Labs did an interview with Alain Durand of Comcast and found out more details about the measurements: http://labs.ripe.net/content/ipv6-monitor .
3. Hurricane Electric
Source:
http://bgp.he.net/ipv6-progress-report.cgi
Description:
Mike Leber from Hurricane Electric did a number of IPv6 measurements looking at Top Level Domains (TLDs), DNS name servers, Usenet servers and web servers. He found that out of 280 TLDs 224 (80%) had IPv6 name servers. He also looked at the reverse DNS and found that 36% of IPv6 reverse DNS servers were reachable via IPv6. And the percentage of IPv6 reverse DNS name servers where IPv6 is as fast or faster than IPv4 (within 1ms) was 69.5%.
He also found that the percentage of AS's currently running IPv6 is 5.5%.
Just like Comcast (see above) Mike Leber also looked at the Alexa list of the most popular websites and checked if they had AAAA records registered in the DNS. Out of the top million domains on the Alexa list, he found 1,459 domains (or 0.15%) with a direct IPv6 address (he also searched for ‘www’ and ‘ipv6’ hosts within the domain). This is consistent with the Comcast results (see above).
More Details:
More detailed results and measurements can be seen on the URL above. Mike Leber had the idea for this test while writing a paper called “Going Native” ( http://bgp.he.net/going-native.pdf ) about Hurricane's experience of adding extensive native IPv6 peering as a result of a core router and backbone upgrade.
4. IPDN
Source:
Description:
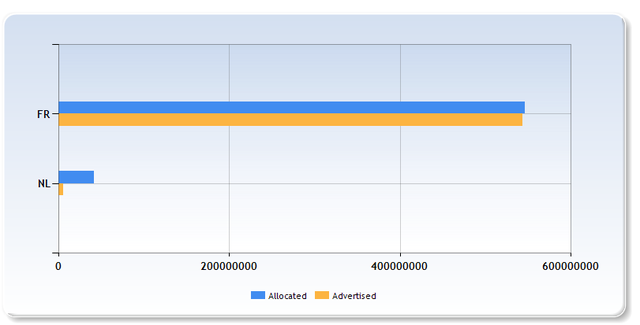
Kuo-Wei Wu from Taiwan produced a number of statistics showing IPv4 and IPv6 address allocations and announcements per country. One can search by various criteria: RIR region, country, year, month, addresses allocated vs. advertised, and so on. This shows, for instance, that in November 2009 in France the total number of IPv6 addresses allocated is very close to the number of IPv6 addresses advertised. By comparison: in the Netherlands the number of advertised addresses is only a fraction of the number of allocated IPv6 addresses.
More Details:
There is a lot more information on this site: Upcoming events, news and articles related to address allocation policies, trends and services, information about ccTLDs and statistics on number of domains registered per TLD. One can also find an IPv4 Exhaustion Counter that shows the number of unallocated IPv4 addresses in the IANA database going down. This is based on data taken from the IANA IPv4 Address Space Registry and the IPv4 Address Report compiled by Geoff Huston of APNIC.
5. Google
Source:
http://www.ripe.net/ripe/meetings/ripe-58/content/presentations/Colitti-IPv6atGoogle-RIPE58.pdf
Description:
Google was trying to find out how common IPv6 was among their users and how much IPv6 still breaks things on a network. The measurements were done by asking a number of Google users to participate in an IPv6 experiment where their browser was asked to perform a background request. The test recorded the user’s IPv4 and IPv6 addresses (if applicable), the request latency and some browser and operating system details. At the time of the measurement, 0.238% of the users performing the test had useful IPv6 connectivity. And 0.09% users had broken IPv6 connectivity. Google concluded that there are at least 1 million distinct IPv6 users on the Internet.
Google also looked at the type of connectivity and found that almost 30% were running native IPv6 and that 6to4 was by far the most popular transition mechanism. It is interesting to note that France is almost 95% native IPv6 where as the US and Canada is running almost entirely on 6to4.
Google concluded that IPv6 deployment is still very low, but that it is growing every week. The type of connectivity is used depends heavily on the operating system used.
6. TNO & GNKS
Source:
Description:
This is a project that runs for two years, having started in January 2009. A consortium of TNO and GNKS is doing the IPv6 deployment research through metrics analyses, questionnaires and measurements in order to determine the number of IPv6-enabled users in Europe in the period 2009—2010. This project was commissioned by the European Commission.
The measurements are described in a White Paper entitled “IPv6 deployment monitoring in Europe”: http://www.ipv6monitoring.eu/project-files?func=fileinfo&id=4
The consortium is measuring the percentage of unique users that is able to connect to the IPv6 Internet and access the most important content and services without noticing any difference. Three set of measurements are being used to do this:
- The number of IPv6-enabled users is measured using a method similar to max.nl and Google
- The number of IPv6-enabled websites is measured, examining both DNS and website access
- The performance of IPv6-enabled websites compared to IPv4-enabled websites is measured using a methodology based on an ITU-T standard
The results will be interesting to compare to the measurements Comcast and Hurricane Electrics are carrying out in this area.
More Details:
There is much more information on the website above. The statistics produced by IPDN (see above) can also be found on it.
A summary of the survey GNKS conducted can be found at:
http://labs.ripe.net/content/ipv6-panel-discussion-results
7. Max.nl
Source:
Description:
This is a website aimed at web server operators set up by Sander Steffann. The site is in Dutch, but the check is pretty straightforward and can be used by anybody.
The test was created because providers hosting websites were worried that making their website reachable over IPv6 would have a negative impact on their customers.
Through a javascript it offers a test where one can check what the impact would be on the visitors if a web server would be set up to offer services over IPv6. It tests native IPv4, native IPv6 and dual-stack IPv4/IPv6. At the moment, this IPv6 test has been used by 64 websites. Up to now more than 6.5 million tests have been performed in total. 0.13% of the tests showed that a visitor would have problems reaching the website once it is reachable over IPv6.
More Details:
There are detailed instructions on the web site about how to perform the tests. There is also a demo page where one can follow the progress of the test while it is going on. It also gives possible reasons that could cause the dual-stack test to fail.
8. Eric Vyncke (Cisco)
Source:
http://www.vyncke.org/countv6/stats.php
Description:
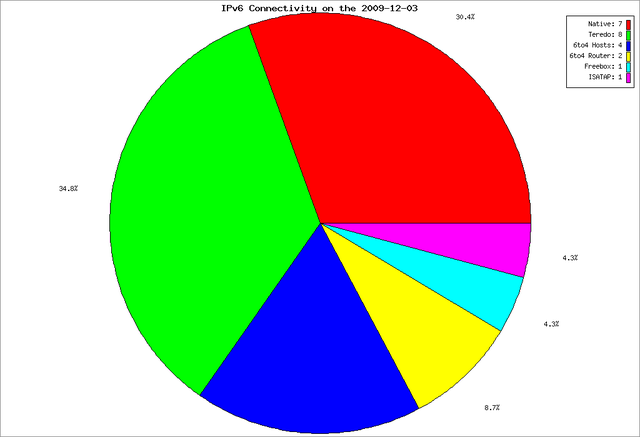
This site provides statistics showing to what extent visitors to this particular website are IPv6-enabled. It uses http-redirect to link dual-stack and IPv6-only measurements. One can sort the data by various criteria: only IPv4 or only IPv6, only IPv6-preferred or only IPv4-preferred, dual-stack or only Freebox, 6to4 or Teredo. One can also see what operating system the visitor is using. There is also historical data.
The overall results are that between 10% and 13% of Internet hosts are IPv6-enabled. This seems high compared to other measurements, probably because this check is not widely published yet and therefore only used by IPv6 enthusiasts.
The results can be seen in graphical form or in table format. It is also explained how the tests are performed.
9. Tore Anderson (Redpill Linpro)
Source:
[UPDATE: http://fud.no/ipv6/ now holds daily updated information , and hit Slashdot ]
http://lists.cluenet.de/pipermail/ipv6-ops/2009-November/002658.html
http://lists.cluenet.de/pipermail/ipv6-ops/2009-December/002707.html
Description:
The first URL above points to a mail Tore Anderson from Redpill Linpro wrote to a mailing list in Germany ( ipv6-ops@lists.cluenet.de ) describing an experiment he conducted in Norway trying to find any eventual breakage that would be caused by dual-stack web sites. He recently published an updated version (see second URL).
In summary: On the dual-stack host, 0.217% of all hits are lost - IPv6 penetration (preference over IPv4) is at 0.403% over November 2009.
Tore found out that the Opera web browser (coupled with Windows Vista or newer, which automatically configure Teredo and 6to4) is causing most of the problems, because it unconditionally prefers IPv6 to IPv4. He believes that until Opera has released a fixed version, it will be difficult to convince customers to dual-stack their production websites. It is worth mentioning that this problem seems to be prominent in Norway, because the market penetration of Opera (a Norwegian company) is likely to be higher than in other countries.
10. Mark Prior (Juniper Networks)
Source:
http://www.mrp.net/IPv6_Survey.html
Description:
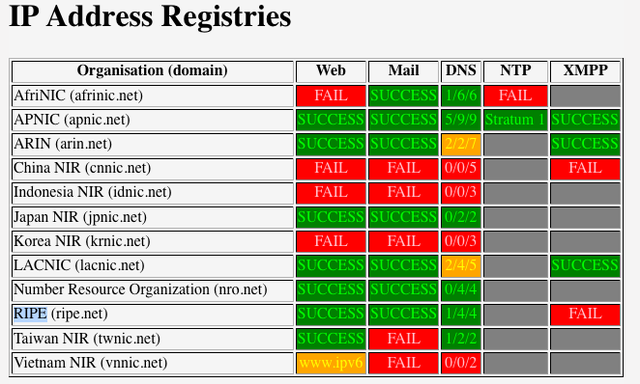
Initially, he was looking at Internet2 members and other universities. He also added a number of ISPs and other organisations that asked to be included and who provided their domain names for the test. RIR sites are also listed.
The results currently show that out of 924 web servers 100 were accessible via IPv6. That is a percentage of 10.8%, which is high compared to other measurements. This is likely caused by the fact that he is looking at sites that are already more likely to be embracing IPv6, such as academic organisations, large ISPs and RIRs.
More Information:
The URL above contains more information about the method used for the test and the detailed results. Mark Prior would be happy to accept suggestions on other organisations or groups of organisation to include in the measurements. For suggestions, please contact Mark Prior: mrp at mrp dot net
11. CAIDA
Source:
http://www.caida.org/research/topology/as_core_network/
Description:
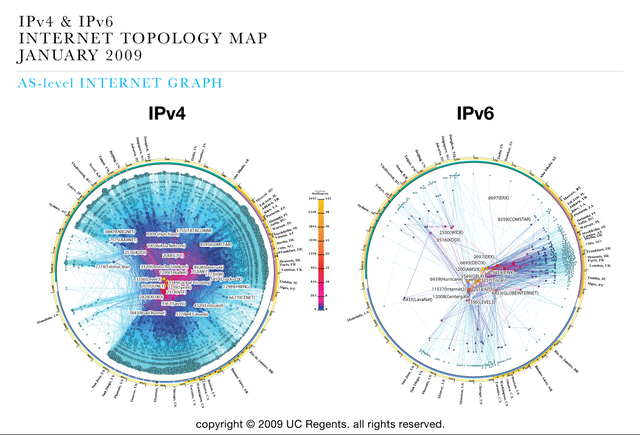
12. RIPE NCC
Source:
Description:
The RIPE NCC offers several measurement services supporting IPv6:
- Test Traffic Measurement
- Routing Information Service
- DNSMON
- Hostcount++
http://www.ripe.net/ttm Test Traffic Measurement (TTM) is the RIPE NCC’s active measurement network. Currently, TTM has over 50 IPv6-enabled measurement nodes around the world and it continuously measures one-way delays, loss and jitter. The http://www.ris.ripe.net Routing Information Service (RIS) collects BGP routing information. The RIS currently supports IPv6 on 13 remote route collectors around the globe. Apart from raw data, the RIS features several query and visualisation tools such as BGPViz ( http://www.ris.ripe.net/bgpviz ) and the RIS Dashboard ( http://www.ris.ripe.net/dashboard/ ).
http://dnsmon.ripe.net DNSMON measures reachability and availability of DNS root and TLD servers. DNSMON currently monitors more than 35 IPv6 enabled TLDs as well as the whole DNS root zone.
http://www.ripe.net/is/hostcount Hostcount++ is also IPv6-enabled and is able to count IPv6 hosts for TLDs that allow AXFR transfers towards the Hostcount++ service.
http://netsense.ripe.net In an effort to unify the data presentation of the RIPE NCC’s measurement services, NetSense has been created and fully supports IPv6.
Thanks to Emile Aben for all his help with this article.


Comments 13
The comments section is closed for articles published more than a year ago. If you'd like to inform us of any issues, please contact us.
Anonymous •
<div class="content legacycomment"> <p> </p> <p> Well, first of all a big <u> THANK YOU! </u> to everyone doing measurements and providing us with the summaries and references! </p> <p> </p> <p> Somehow related to the comparisons, percent-wise, of the IPv6-based population on the 'net versus the IPv4-world, I am struggling with a similar(?) issue: how do I get a representative comparison of IPv6-based performance to sites which my users traditionally access by way of IPv4? </p> <p> </p> <p> Of course, my first hope was the TTM-cloud. </p> <p> </p> <p> I do have some ideas, but I'd like to see a discussion started - somewhere - to find out what is easy to implement and what is useful for a bigger community at the same time. </p> <p> </p> </div>
Anonymous •
<div class="content legacycomment"> <p> </p> <p> Hi, <br /> <br /> Brian Carpenter has been posting about this survey on several IPv6 operations related mailing lists. It is aimed to the ISPs, and the goal is to provide facts for the IETF document: ". <br /> <br /> Here is the link to the survey: <a href="http://www.cs.auckland.ac.nz/~brian/ISP-v6-QQ.html"> www.cs.auckland.ac.nz/~brian/ISP-v6-QQ.html </a> <br /> <br /> Regards, <br /> Vesna <br /> </p> </div>
Anonymous •
<div class="content legacycomment"> <p> On request I created a breakdown for Africa, similar to the breakdowns in <a href="http://labs.ripe.net/content/measuring-ipv6-web-clients-and-caching-resolvers-part-2-country-level-and-other-statistics" title="http://labs.ripe.net/content/measuring-ipv6-web-clients-and-caching-resolvers-part-2-country-level-and-other-statistics"> http://labs.ripe.net/content/measuring-ipv6-web-clients-and-caching-reso... </a> . We have few measurements here, so take this with a grain of salt. I excluded all countries with less then 15 measurements; all of them didn't have any IPv6 capabilities that we detected. </p> <p> </p> <p> It is good to see South Africa and Kenya with client IPv6 capabilities, but surprising to see no IPv6 connections from Egypt. The IPv6 resolvers that we see for clients in Nigeria and Algeria are in big global ASs (AS701 and AS174 respectively), wheras resolvers for clients in Tunisia are in AS2609 (TN-BB-AS/Tunisia BackBone AS). </p> </div>
Anonymous •
<div class="content legacycomment"> <p> Hi, </p> <p> </p> <p> a few suggestions on why you're seeing higher hb.db client loss than I do: </p> <p> </p> <ul> <li> How large are the HTTP requests/responses? If you're exceeding 1280 octets in either direction, you could be observing PMTUD issues. I've not attempted to measure that at all - in my setup, the requests are all small. My plan is to use an IPv6 MTU of 1280 and advertise a TCP MSS of 1220 when I dualstack a "real" web site, just to avoid this potential problem. Maybe later I will attempt to measure how much of a problem it really is, if at all. </li> <li> How is your 6to4 connectivity? Do you run a local 6to4 return relay to which 2002::/16 is routed, and do you announce a public relay (192.88.99.0/24) to peers? (I do both.) From what I've been able to determine, unnecessary use of 6to4 is the cause of almost all brokenness. Anycasted 6to4 is way less reliable than IPv4, so all you can do is to try to make it as good as possible in order to improve the client loss percentage. </li> </ul> <p> </p> <p> When it comes to determining causes for lost clients, pay very close attention to users of Opera in versions earlier than 10.50 on Windows Vista or newer ( <a href="http://my.opera.com/community/forums/topic.dml?id=298893"> more info </a> ), and all users of Mac OS X ( <a href="http://lists.apple.com/archives/Ipv6-dev/2010/Mar/msg00003.html"> more info </a> ). Both of these setups will prefer 6to4 much more than they should, which in turn causes most of the problems. If I simply filter away all log lines with Opera and OS X in the User-Agent field before running my scripts, the measured client loss is _very_ close to 0% (even negative, on individual days). </p> <p> </p> <p> I have one final suggestion as to why you're seeing such a high client loss: You write that «[a]ll measurements where the h4.d4 test doesn't succeed are discarded». I really think you should not do that, because you then assume that _all_ of the hb.db failures are due to the dualstacking. In reality, all types of requests, both the h4.d4 ones and the hb.db ones, fail from time to time, for reasons that have nothing to do with IPv6 or dualstacking (in the h4.d4 case, it must be all of them). It stands to reason that there's a percentage of the hb.db failures that are caused by the same reasons. For instance, my numbers from <a href="http://www.vg.no"> VG </a> for yesterday are: </p> <p> </p> <pre> [N] linkgen.php hits (num of UUIDs generated): 2087303 [N_OK] UUIDs that was seen on both dualstack and ipv4-only: 2061803 (98.778% of N) [Nd] UUIDs that was seen on dualstack only: 1362 (0.065% of N) [Ns] UUIDs that was seen on singlestack only: 2683 (0.129% of N) </pre> <div> </div> <div> Obviously, the 1362 requests that only came in to the dualstack host did not do so because they have defective IPv4 connectivity - if they did, they would not be able to participate in the experiment at all since it's being served from a IPv4-only web site. I make the assumption that this amount of client loss also will happen on the dualstack host too, for the same reasons (which have nothing to do with IPv6 and dualstacking), so the way I see it, the interesting figure is the delta between Nd and Ns, not Ns in itself. However, from what I understood when reading the article, what you're measuring is equivalent to my Ns. And that would mean a much higher reported (but not actual) brokenness. </div> <div> </div> <div> Numbers for March looks good so far, Opera 10.51 was pushed to auto-update a week ago or so and it's share amongst Opera users on Windows Vista/7 is increasing by about 5% per day, and I can clearly see that it has an impact - the 0.064% figure I got from yesterday was a record low. The Mac OS X problem is more tricky though. I'm thinking of trying to talk my customers into something à la <a href="http://thatnorwegianguy.com/2009/02/norwegian-ie6-spring-cleaning/"> the Norwegian IE6 spring cleaning </a> , just this time for Opera <10.50 on Windows and all Mac OS X users that are seen connecting with 6to4 to a dualstack site. I've started on something <a href="http://ajaxtest.fud.no/test.php"> here </a> , but it doesn't work in all browsers, and it lacks a timeout trigger and action (to identify dualstack requests that fail completely). Last time I did anything resembling web developement was last century however, so it would be really cool if anyone with AJAX skills would pick up on the idea and make something that works 100%! </div> <div> </div> <div> By the way, the link you gave to my numbers are not really too interesting as I didn't have numbers for the whole month. The <a href="http://thread.gmane.org/gmane.org.operators.ipv6/2934"> February numbers </a> are more complete. And you got my name wrong...but I'm used to that. :-) </div> </div>
Anonymous •
<div class="content legacycomment"> <p> Hi Tore, Thanks much for your comments. As for your first 2 points: PMTUD shouldn't play a role, requests and responses are small. Ben Stasiewicz from the WAND group in New Zealand is doing some interesting work on PMTUD in IPv6 ( <a href="http://wand.net.nz/~bss7/pmtud-ben-final.pdf" title="http://wand.net.nz/~bss7/pmtud-ben-final.pdf"> http://wand.net.nz/~bss7/pmtud-ben-final.pdf </a> ). And we don't do anything 6to4-ish that I'm aware of (but I'm not running the network), so that could have an influence. </p> <p> </p> <p> I think your Ns is equivalent to my h4.d4, your Nd is my hb.db, but I don't have an N (I can count all unique IDs that I receive measurements for, which is probably a slight undercount of N). I'm surprised that you lose 1% going from N to Ns. I looked into my data again and much can be explained from this 'random' loss, which I didn't expect to be this high (1% of objects on a web page doesn't get fetched?!). I went through a couple of iterations of the measurement script and on Feb 1 the order of tests was <strong> h4d4 </strong> , h4d6, <strong> hbdb </strong> , h6d4, h6d6. This results in 1.30% loss ( Ns - Nd / N , where N is the number of unique ID's I see, the real N is probably more). On Feb 4 I changed the order of tests to <strong> hbdb </strong> ,h4d6,h6d6,h6d4, <strong> h4d4 </strong> , with the idea to discard everything that didn't finish the h4d4 test. For Feb 5 (Ns - Nd / N) is -2.72%, so dual stack has less loss then v4-only according to this metric! It seems the order of tests does matter a lot, and if I recall correctly you do randomize the order of measurements, which would be the right thing to do for my measurements if we want to compare loss numbers, although I'd always have a (slight) undercount of N, so my loss numbers would be (slightly) higher. </p> <p> </p> <p> I fixed the stats link and ( more importantly :) ) your name in the article, apologies for that. </p> <p> </p> <p> regards and thanks for your measurement work on dual-stack loss! </p> <p> Emile </p> </div>
Anonymous •
<div class="content legacycomment"> <p> Hi Emile, </p> <p> </p> <p> thanks for the pointer to the PMTUD paper. _5%_ PMTUD failure rate, wow, that's scary stuff... </p> <p> </p> <p> When it comes to 6to4 you can try to do a traceroute to a 6to4-enabled destination (2002::/16) and see how far away from you the return relay is. If it's far away you might want to ask the network ops to set up a local one as close to the content as you can. In the inbound direction it's much harder to improve on trampolines, especially if the site in question has a global audience. In my case all the content is in Norwegian, so announcing the relay to my peers at NIX helps a lot. </p> <p> </p> <p> Regarding the measurements and methology: </p> <p> </p> <ul> <li> Your h4.d4 hit count is equivalent to my N_OK+Ns hit count (2064486 using the numbers from my previous comment). </li> <li> You say you discard everything that's not also seen on h4.d4, so you do not have anything equivalent to my Nd. </li> <li> I don't think it's that surprising that you see a loss from N, for instance a browser with image loading disabled will fall into this category, which is probably not uncommon with mobile clients. </li> <li> A total count of unique UUIDs seen (regardless of hostname) would be useful. My equivalent to that would be N_OK+Ns+Nd = 2065848 reqs («N_any»). </li> <li> Using the above N_any instead of N_OK as 100% when calculating brokenness yields a Ns-Nd delta of 0.064% ((100 / 2065848 * 2683) - (100 / 2065848 * 1362)). </li> <li> You're right that using N_any instead of N will yield a slightly higher loss number, but it's a _very_ slight difference - 0.000657 percentage points in my case, barely enough to tip the brokenness number up to 0.064% (from 0.063%)... </li> <li> ...so using N_any instead of N (which you don't have) will definitively give you an useful figure. It could very well be that it's a more accurate figure than using N, too - I'm certainly not a statistics expert. </li> </ul> <p> </p> <p> I started out in much the same way as you, expecting the "baseline" IPv4-only request to succeed all the time and placing it always last in the generated HTML code (although I didn't go as far as you with the five-sec delay and all), but it quickly became apparant that by doing so I was introducing a bias that skewed the results enough for them to not be very useful anymore. So I think you're much better off by treating everything in the same way as much as you can, ie. removing the five-sec delay and randomising the order of the links in the generated HTML, and using N_any (or possibly N, if you can start logging that too) as the baseline measurement (what's regarded as 100% of participating clients I mean) instead of the h4.d4 hit count. It would certainly be interesting to see how your numbers change if you start doing the measurement in this way! </p> <p> </p> <p> BTW, you only changed my name in one out of two places, and it was the other place I had in mind regarding changing the link to my report too... </p> </div>
Anonymous •
<div class="content legacycomment"> <p> Hi Tore, </p> <p> </p> <p> Sorry about misspelling your name. I corrected it and also included a link to the more up to date report. I hope this is ok now: </p> <p> </p> <p> <a href="http://labs.ripe.net/content/measuring-ipv6-web-clients-and-caching-resolvers-part-3-methodology" title="http://labs.ripe.net/content/measuring-ipv6-web-clients-and-caching-resolvers-part-3-methodology"> http://labs.ripe.net/content/measuring-ipv6-web-clients-and-caching-reso... </a> </p> <p> </p> <p> I let Emile respond to your other points. </p> <p> </p> <p> Mirjam </p> </div>
Anonymous •
<div class="content legacycomment"> <p> Thanks again for your comments. Adding randomization and removing the 5 secs again is on top of my list of next steps for these measurements. </p> <p> Emile </p> </div>
Anonymous •
<div class="content legacycomment"> <p> After about a day of data for the measurements on <a href="http://www.ripe.net" title="www.ripe.net"> www.ripe.net </a> with the submeasurements randomized I see: <br /> IDs (N_all): 8956 </p> <p> IDs ONLY in ipv4 (Ns): 113 <br /> IDs ONLY in dual (Nd): 100 <br /> Ns - Nd: 13 <br /> Ns - Nd (% of N): 0.145154086645824 </p> <p> So in the same ballpark as Tore's and Sander's measurements, but still very high when considering the measurement script was served from a dual stack website. Will continue monitoring. </p> <p> Emile </p> </div>
Anonymous •
<div class="content legacycomment"> <p> Hi again, </p> <p> </p> <p> I've finally gotten around to creating a web page for my measurements, complete with graphs and daily automatic updates. It's probably much more interesting to look at than the mailing list post, so I was wondering if you could change the link in the article to point to it? The URL is <a href="http://fud.no/ipv6/"> http://fud.no/ipv6/ </a> . </p> <p> </p> <p> Client loss has stabilised at around 0.04% following the release of Opera 10.50, by the way. Now it's only up to Apple to fix the rest of the issues... </p> <p> </p> <p> Best regards, </p> <p> Tore </p> </div>
Anonymous •
<div class="content legacycomment"> <p> Thanks for the update and for your excellent work! <br /> I've updated <a href="http://labs.ripe.net/content/ipv6-measurements-compilation" title="http://labs.ripe.net/content/ipv6-measurements-compilation"> http://labs.ripe.net/content/ipv6-measurements-compilation </a> to include your web page </p> <p> best regards, <br /> Emile </p> </div>
Anonymous •
<div class="content legacycomment"> <p> Another wonderful graph showing annual increases of 100% for IPv6! This clearly shows interest in IPv6 is picking up in a real, measurable way. </p> <p> </p> <p> Yay! </p> <p> </p> <p> But as always with such graphs, I wonder about the comparison with IPv4... how many IPv6 allocation requests did the RIPE NCC receive over the same time period? (If it's like IPv6 vs IPv4 traffic comparisons, you may need a logarithmic graph so the IPv6 requests don't get lost!) </p> </div>
Anonymous •
<div class="content legacycomment"> <p> </p> <p> I could include some IPv4 graphs too, but they are not that fascinating :-) </p> <p> </p> <p> Of course RS have a number of graphs like this, for the different queues. Rest assured, we'll post some of them, should they become "interesting"! :) </p> <p> </p> <p> Robert <br /> </p> </div>