
This article aims to raise awareness about bias in the Internet measurement infrastructure; e.g., RIPE Atlas, RIPE RIS. What is bias? Is the infrastructure biased? Is it a problem? The article discusses these issues and presents data that can help users to interpret or conduct measurements.
Network operators make frequent use of the infrastructure and platforms for Internet monitoring and measurements made publicly available by the RIPE NCC (RIPE RIS, RIPE Atlas, RIPEstat) and others (e.g. RouteViews, etc.). They use this measurement data - e.g., latencies or BGP paths - for detecting routing events that affect their traffic, or for troubleshooting, topology discovery, route optimisation, and so on. To correctly interpret the measurement data, it is often important to understand the measurement setup and potential limitations of the infrastructure.
The infrastructure and platforms for Internet monitoring and measurements (“measurement infrastructure” hereon, for brevity) provide a richer view of the Internet routing system than that which operators have from their own network. However, not every network hosts measurement infrastructure. For example, RIPE Atlas has around 11,000 probes in around 3,300 Autonomous Systems (ASes) out of a total of over 70,000 ASes. And RIPE RIS and RouteViews collect BGP feeds from close to 300 and 500 peering ASes respectively.
That we only have a partial view of the Internet is more-or-less well-known by the network operator community. However, this does raise the question: Is this view representative of what happens on the Internet, or is it biased and can result in misleading insights?
In this article, we discuss and study the issue of bias in measurement infrastructure, and try to give answers to the following questions:
- What is bias?
- Is Internet measurement infrastructure biased?
And, if yes:
- How much? How can bias be measured or quantified?
- Are users aware of/concerned about this bias?
- Is bias a problem? Does it affect our findings (i.e., the insights we get from measurement data)?
- What can be done?
Examples of bias and analogies
Let’s first try to understand the notion and implications of bias through a simple toy example (see also Table 1), and then proceed to the more complicated case of bias in Internet measurement infrastructure.
Defining bias: Assume a population of 100 people, of which 50 are men and 50 are women. If we do a survey and ask 10 of them, 8 men and 2 women, then the sample we get is biased towards men. Why? Because the fractions of men and women in the population are 50% and 50%, respectively, whereas in our sample they are 80% and 20%. In other words, there is a difference in the distributions between the entire population and our sample.
Measuring bias: Hence, to quantify how much bias the sample has, one can measure the distribution distance among the population and the sample distributions.
Is bias a problem? It depends! We may ask the survey participants what their height is, to calculate an average for the entire population; then probably we get biased results, since men, who are typically taller than women, are over-represented in our sample. However, we may ask them what their native language is; in this case, the fact that we have a gender-biased sample would not affect our findings. In other words, bias may or may not affect our measurement findings; it depends on how it relates to the insight we want to gain.
Dimensions of bias: Now, think also that in our population, 70% of people are from country A and 30% from country B, and in our sample the corresponding fractions are 80% and 20%. Therefore, in a dataset there may be multiple dimensions of bias (here, gender and country bias). In our example, gender bias is higher than country bias; i.e., the extent of bias can be different among different dimensions. Finally, both biases could affect our findings about average height (to different extents though); however, only the country-bias would affect our findings about the native language; i.e., different bias dimensions may affect our findings differently.
| Men | Women | Country A | Country B | |
|---|---|---|---|---|
| Population | 50% | 50% | 70% | 30% |
| Measurement sample | 80% | 20% | 80% | 20% |
Examples of biases in Internet measurement infrastructure and open questions
RIPE RIS and RIPE Atlas are two sets of measurement infrastructure provided by RIPE NCC. A glance at the map with the locations of this infrastructure (Figure 1) reveals a higher density in Europe, which is in imbalance with the spread of ASes around the world; i.e., there is location bias in RIPE Atlas and RIPE RIS.
Are users aware of this bias? We would expect that this is known among the users of the measurement infrastructure, since RIPE NCC is the Regional Internet Registry (RIR) for Europe, Middle East and Central Asia. However, which of RIPE Atlas or RIPE RIS is less biased? This may be difficult to answer even for expert users. For example, as we show later, when we consider location bias at a country-level, RIPE RIS is significantly more biased than RIPE Atlas, whereas at a continent-level both RIPE RIS and RIPE Atlas have a similar bias.
Moreover, even if RIPE Atlas is less biased than RIPE RIS, typically the users do not conduct measurements from the entire set of RIPE Atlas probes, but only a subset of them (e.g., a few probes) due to rate limitations enforced by the platform. On the contrary, RIPE RIS provides passive measurements that are available from the entire set of route collectors. How does the bias change when using only a subset of the infrastructure? Do things get better, worse or the same?

RIPE RIS and RouteViews are both projects for passive monitoring of the Internet routing system, and have route collectors that receive BGP feeds from peering networks.
Which of them is less biased? The answer may depend on the dimension of bias and/or the purpose they are used for. For example, our analysis shows that RIPE RIS is less biased in terms of network size, while RouteViews is less biased in terms of location. Network size or location may be relevant or not in different use cases, and having quantified the bias of each measurement infrastructure may help a network operator to select which platform to use.
Quantifying bias
Similarly to the above toy example where people are characterised by two features (gender and origin country), Internet measurement infrastructure can also be characterised by a multitude of features. For example a measurement vantage point, a network, or an Autonomous System (AS) can be characterised by their location, connectivity, traffic levels, etc.. Each characteristic/feature can be considered as a dimension, and the bias can be calculated over each dimension.
Data: We take into account the characteristics of the Internet measurement infrastructure at an AS-level granularity (e.g., two RIPE Atlas probes in the same AS have the same AS-level characteristics); of course, our analysis is extensible to a more fine-grained level. We collect for all ASes characteristics from the following data sources: CAIDA’s AS-rank, PeeringDB, Internet Health Report (AS-hegemony), and bgp.tools.
Dimensions: From the collected data, we select a number of features/characteristics that we consider more relevant to the definition of bias, and group them in the following categories:
- Location (RIR region; Country; Continent)
- Network size (Number of ASNs, IP prefixes and IP addresses in the customer cone; AS hegemony)
- Topology (number of neighbours: total, peers, customers, providers)
- IXP-related (number of connections to IXPs and facilities; peering policy)
- Network type (network type; traffic ratio; traffic volume; scope; personal AS tag)
Bias metric: For each characteristic/dimension we calculate two distributions: (i) the distribution of the characteristic over the entire population of ASes, and (ii) the distribution of the characteristic over the ASes that are part of the measurement infrastructure (i.e., in the case of RIPE Atlas, they are the ASes that host at least one active probe, and in the case of RIPE RIS they are the ASes that provide BGP feeds to at least one route collector). We quantify the difference between the two distributions and capture this in a value between 0 and 1 (the “bias metric”; see more details in the methodology description), where the higher the number the more the measurement infrastructure ASes differ from the total population of ASes in the dimension that we look at.
Figure 2 shows an example of the distributions for two dimensions. In the left plot we present the distributions for the dimension of “Location (continent)”. The blue bars correspond to the distribution over the entire population of ASes, and the orange / green / red bars to the RIPE Atlas / RIPE RIS / RouteViews infrastructures, respectively. We can see that the distributions of RIPE Atlas and RIPE RIS differ significantly from the distribution of the entire population of ASes. On the contrary, the RouteViews infrastructure follows a similar distribution to the entire population. The bias metric in this case is higher for RIPE Atlas (bias metric = 0.06) and RIPE RIS (0.07) than in RouteViews (0.01).
The right plot in Figure 2 shows the distributions of the same sets of ASes for a different dimension: the “Peering policy”. Here, the distributions differ less and the bias scores are lower (0.01, 0.01 and 0.02 for RIPE Atlas, RIPE RIS, and RouteViews, respectively).

Bias: analysis and results
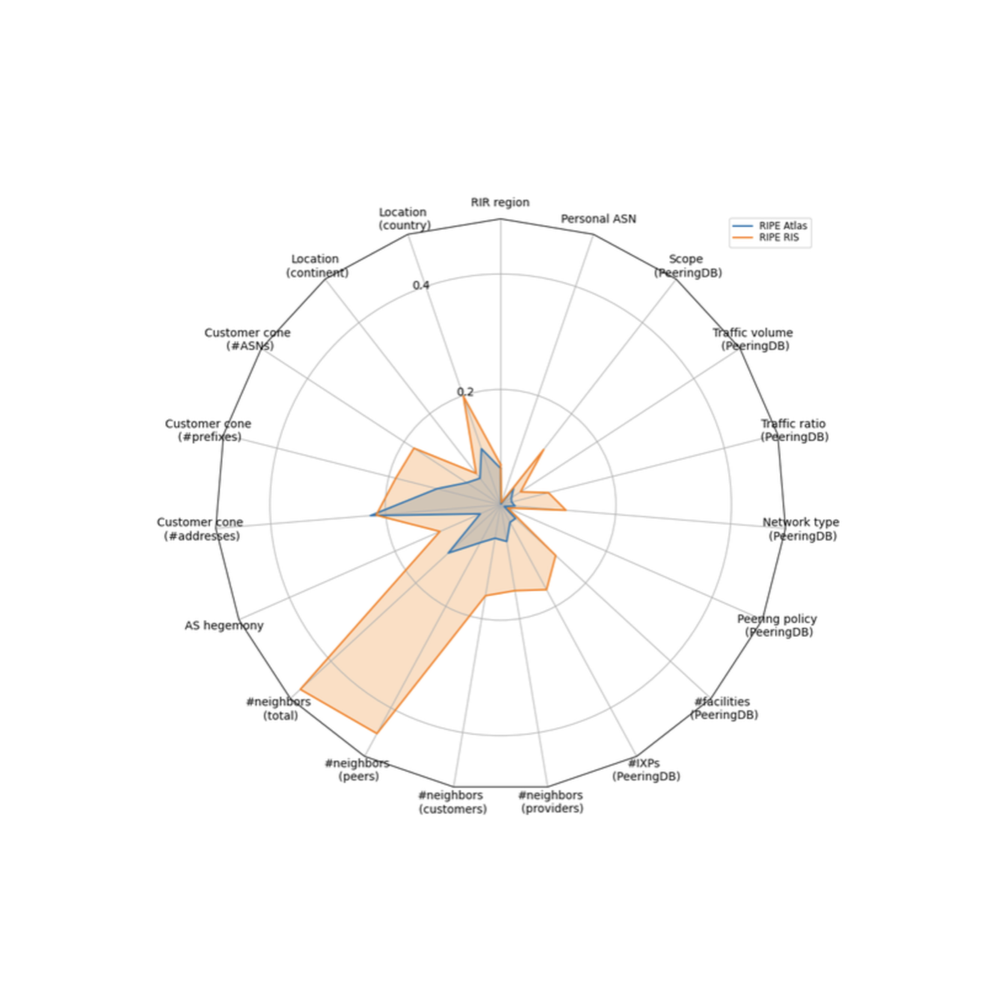
Figure 3 shows the bias scores over all the dimensions we considered in a radar plot. Each radius in the plot corresponds to a dimension. The coloured lines correspond to the value of the bias metric along this dimension; e.g., the bias score for RIPE RIS (orange line) in the dimension “Location (country)” is 0.2. Larger values of the bias score (i.e., farther from the centre) correspond to more bias; e.g., in the dimension “Location (country)” RIPE RIS is more biased than RIPE Atlas. A value in the centre indicates almost zero bias along the corresponding dimension (e.g., see dimension “Personal ASN”).
Several interesting observations can be made from the results in Figure 3:
- The bias differs significantly between different sets of measurement infrastructure: RIPE Atlas is significantly less biased than RIPE RIS in almost all dimensions/characteristics
- The bias on the measurement infrastructure differs significantly along different dimensions/characteristics
- RIPE RIS has the largest bias in terms of the number of neighbours, total and peers (i.e., topological characteristics); this can be explained by the fact that the RIPE RIS route collectors are deployed at several Internet eXchange Points (IXPs), where ASes establish a lot of peering connections
- RIPE RIS is also quite biased in terms of network size (see “Customer cone” dimensions), which is due to the fact that many large ISPs provide feeds to the route collectors; having feeds from large ISPs may be desired in terms of visibility or coverage, however, it may lead to biased measurements
- RIPE Atlas is also more biased towards topology and network size dimensions (compared to other dimensions), however, at a smaller extent compared to RIPE RIS
- In terms of IXP-related and network type dimensions (that correspond to data mainly from PeeringDB), both RIPE RIS and RIPE Atlas have relatively low bias

Figure 4 compares the bias in the RIPE RIS (blue) and RouteViews (orange) measurement infrastructures. Also, it shows the bias for the combined infrastructure (green), i.e., when we use feeds from both infrastructures (e.g., through frameworks such as the CAIDA BGPStream).
- There is no clear difference between RIPE RIS and RouteViews (in contrast to the RIPE Atlas vs RIPE RIS case we discussed above). RIPE RIS is more biased in terms of topology (number of neighbours, total and peers), whereas RouteViews is more biased in terms of network sizes (“Customer cone” and “AS hegemony” dimensions). In most IXP-related dimensions, both infrastructures have a similar bias
- When using both infrastructures combined, the bias decreases in most dimensions. However, the gains are not significant. In some cases, e.g., in number of neighbours (total and peers), it would be preferable -in terms of bias- to use only the RouteViews infrastructure than using both

More detailed results about biases in the Internet measurement infrastructure (e.g., comparison of IPv4 vs. IPv6 infrastructure, or full-feeding vs. partially-feeding peers of route collectors) can be found in the github repository of our project.
Taking stock and thinking ahead
The main goal of this article is to raise awareness about the issue of bias in the Internet measurement infrastructure: our analysis shows that there is bias, and we believe that all users of the infrastructure should be informed about this.
In a survey we conducted among network operators and researchers, asking the participants whether they believe there is bias in their measurements, 52% replied “Yes / Probably yes”, 26% replied “No / Probably no”, and 22% “I don’t know”. This indicates that a significant fraction of users are not aware of the limitations of Internet measurement infrastructure in terms of bias. Moreover, having a clearer view on the bias (dimensions, metric, etc.) would be beneficial even for the more expert users that are already aware or suspect that there is some bias.
So… what can be done?
First of all, being informed that there is bias in the infrastructure (and how much) can help the users to more carefully interpret the results of their measurements and avoid pitfalls or wrong generalisations. Moreover, users can fine-tune their measurements based on the existing bias, e.g., select which infrastructure to use (e.g., RIPE RIS or RouteViews or both) or select the vantage points of a given infrastructure (e.g., a set of RIPE Atlas probes).
To this end, the AI4NetMon project (the above analysis is part of the project activities) aims to deliver methods for selecting infrastructure sets (e.g., subsets of RIPE Atlas probes, or subsets of feeding peers of RIPE RIS or RouteViews) that can result in less biased findings.
The work presented in this article is part of a collaboration with Lars Prehn, Max Planck Institute, and Emile Aben, RIPE NCC.
Comments 2
The comments section is closed for articles published more than a year ago. If you'd like to inform us of any issues, please contact us.
Stéphane Bortzmeyer •
Unless I'm wrong, the bias for RIPE Atlas probes is measured by the number of probes in the AS. Isn't there also a bias when asking N probes for a measurement, without specifying area/country/AS? Are we guaranteed that the set of probes we obtain respects the general population of probes? Or is there an extra bias here?
Pavlos Sermpezis •
Thanks Stéphane for bringing this up! The bias for RIPE Atlas shown in the plots corresponds to the entire set of RIPE Atlas probes (i.e., if someone did measurements using all the 11k probes, he/she would have this bias). When asking only N probes for measurements, which is what happens in practice, the bias we have is higher. The smaller the number of probes N, the higher the bias. You can see some preliminary results/visuals on this (i.e., number of probes N vs bias) at this readme page https://github.com/sermpezis/ai4netmon/blob/main/use_cases/bias_in_monitoring_infrastructure/Bias_vs_sampling.md on our project's github