Clouds are essential. But predicting whether they can handle demands for heavy computing and low latency isn't straightforward. Turning to RIPE Atlas, we carried out a measurement campaign to find out whether it's possible to understand exactly what kind of latency cloud service users experience.
In today's digital landscape, cloud computing has become an integral part of everyday life. People access the cloud to use entertainment services like Netflix, to backup their precious data using OneDrive or Dropbox, to engage in real-time work collaboration using Google Workspace or similar services, and lots more. Meanwhile, developers leverage cloud-based virtual computing resources both for experimentation and to launch scalable pay-as-you-go services.
To serve all these needs, infrastructure providers are challenged with providing seamless access to the cloud services. In addition, they also have to plan ahead for new killer apps that are computationally heavy and require low latency - such as Immersive Realities, Unmanned Autonomous Devices, and Internet of Things ecosystems - which can place unprecedented demands on cloud infrastructure.
The problem
Cloud users, especially those using services requiring heavy computing and low latency, need to be able to predict whether the cloud can deliver the services they require ahead of using the service. In cases in which the requirements cannot be met, the use cases call for the use of edge servers, which can alleviate the latency constraints.
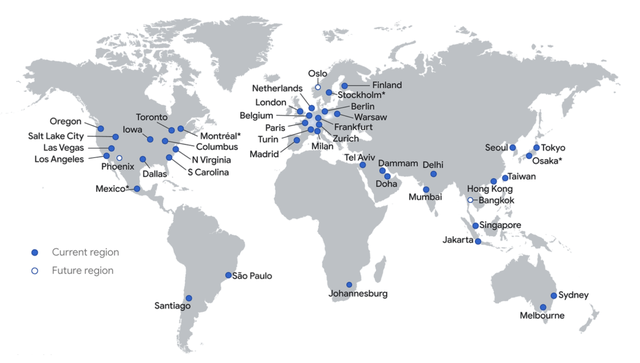
The challenge of course is that “Clouds” are heterogenous in terms geographical distribution and computation capabilities (e.g., Amazon Web Services1, or Google Cloud Platform2).
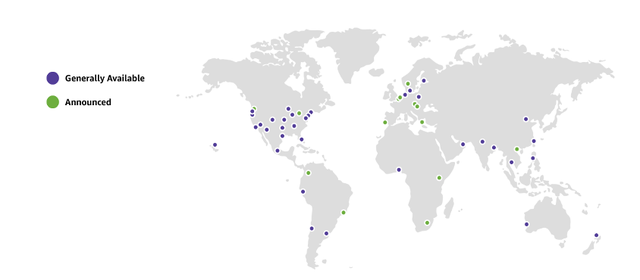
What's more, clouds are also comprised of multiple physical devices owned by the cloud provider, which are often interconnected through private networks and concentrated in particular regions.
Given the variety of cloud services utilised, we find that users, service providers, and infrastructure providers would strongly benefit from being able to predict network performance between the end users and the cloud providers. Motivated by this, we carried out a measurement campaign to answer these specific questions when it comes to providing a cloud service:
- If we can gather statistically relevant pools of data, can we learn latency characteristics for a given user location and cloud server location?
- In addition, can we forecast future connectivity performance based on the previous characterisation (1)?
- What are the most suitable mathematical analyses or machine learning tools that can help us generate empirical models for each cloud premise’s reachability?
- Using explainable algorithms, can we understand which features are the most important in making latency predictions for cloud premises?
The study methodology
Before we start, we need to identify the tools best suited for the questions we wish to answer. Since we are targeting an active measurement campaign with distributed nodes across a broad geographical area, the RIPE ATLAS platform is ideal for this goal.
We used RIPE ATLAS to carry out a three month traceroute measurement campaign at 30-minute intervals between 256 probes (see the original conference paper3 for detailed methodology and extended results). The source probes were inside three of the main cloud providers (Amazon AWS, Google Cloud and Microsoft Azure) while all destination probes belong to a major Spanish Infrastructure operator (Telefónica). The geographical scope of the study is focused on Spain and the closest cloud site for each cloud provider (which are located either in Spain or in France). The map below gives an overview of the location of the cloud probes and the destination probes.
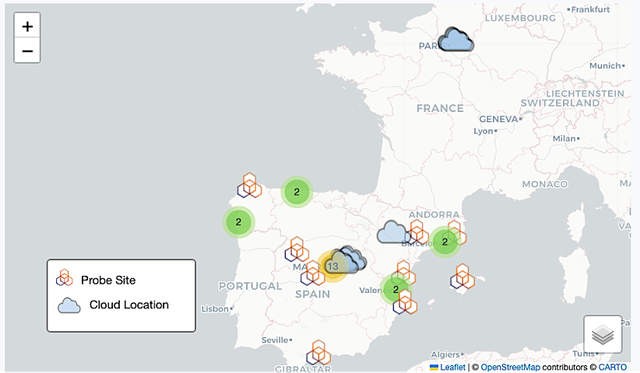
We expressly installed RIPE Atlas probes in the source locations (cloud data centres) as destination probes. The Spanish provider Telefónica had 224 active RIPE ATLAS probes in Spain. To ensure a correct data collection for our study, we selected the probes that had been online: (1) at least 99% of the last week before the campaign started; (2) at least 99% of last month before the campaign started; and (3) at least 80% of the time since they were registered with RIPE ATLAS. This resulted in 36 destination probes. These were eventually whittled down to 32 probes as four of those probes returned a large number of timeouts.
Main outcomes of the study
- No clear daily patterns: We clustered all the measurements based on the hour of the day and plotted the mean, median, and 90th percentile each hour of the day over three months. From the daily patterns, we can see the network latency is remarkably constant across all 24 hours and across all the eight clouds with only mild variations of about 1-2ms during the peak hours (0900hrs, 1400hrs, and 2100hrs)
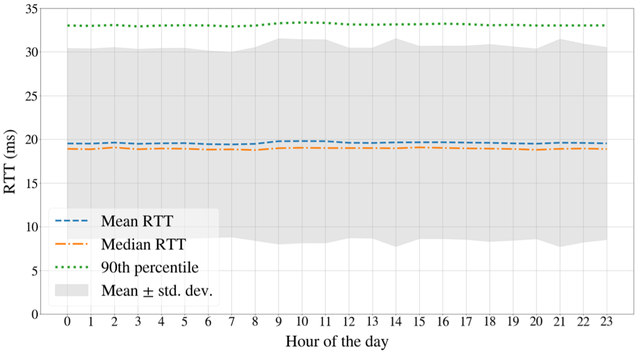
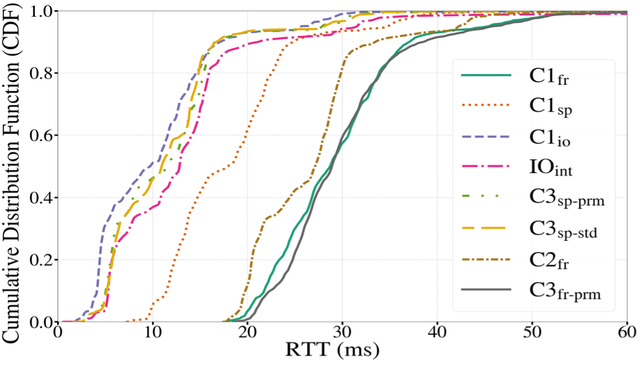
- Most users can reach the cloud in under 50ms: In fact, we see that most of the users in Spain are able to reach the clouds within 20ms, with the cloud probes in France being reachable at slightly higher values ~ 35ms.
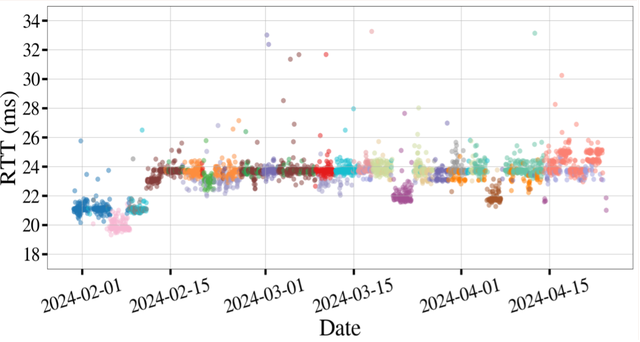
- The specific network path matters: If you look at the specific IP path taken by a user to the cloud, you will find that it will affect the specific latency they experience. The plot below shows the routes for a single source destination probe segregated by colour. Plots for other pairs were similar. By careful path selection you can sure the cloud user mostly uses the lower latency path.
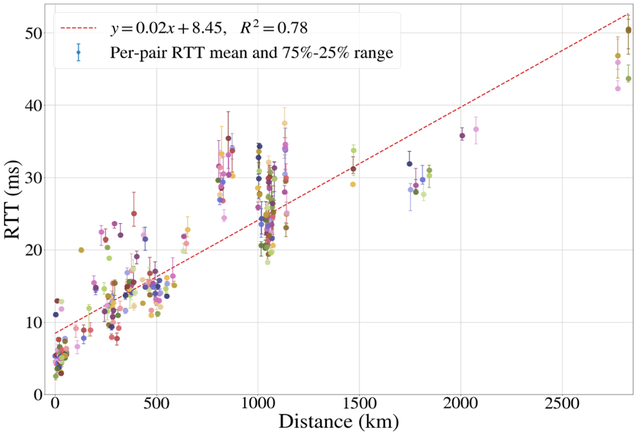
- Every 100km incurs a 2ms increase in latency: We have seen that longer distance means higher latency (takeaway 2). However, but if we wish to quantity just how important, we can use a regression line and the least squares method on a plot of the latency for each source-distance pair against distance. What we see is a 2ms increase for every 100km increase in distance from cloud to user with a minimum delay of 8ms.
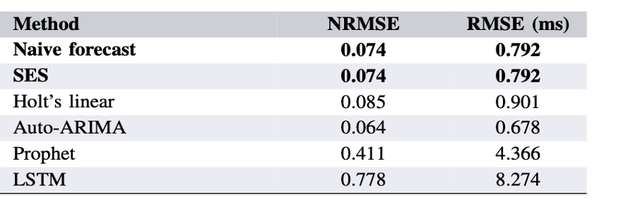
- Time series methods give good next sample predictions: The measurements obtained can be formatted into a timeseries which allows us to use several well established timeseries forecasting methods as well as LSTM, a neural network optimised for using historical data for prediction purposes. The results in the table below show that the simpler methods perform better probably because the cloud latency was flat with very small variations.
- Tree based spatial forecasting methods perform best. We performed spatial forecasting in two scenarios. One with distance as the only feature and in the second case the forecasts used all features4 available from RIPE ATLAS. The next step was to perform a full data science methodology on the measurements.5 We needed to specify that we split the data 80/20, with 20% being the test set. We ran the experiment 20 times for each method. For each experiment we ran, we used random number to select which source destination pairs would fall into the training set with the remaining pairs falling into the test set. The results are below with the tree-based methods performing best.
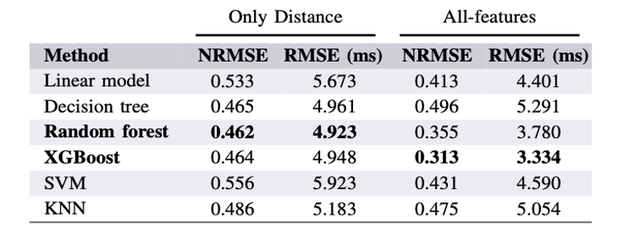
- Explainable Algorithms emphasise that distance is the most important feature. To understand which features are responsible for the cloud latency users are experiencing, we use LIME and SHAP the most commonly utilised explainable AI algorithms on the best performing machine learning methods (XGBOOST and Random Forest). As expected we find that distance is the most important feature with other features not being as important.

Final comments
We set out to answer whether it was possible to understand exactly what kind of latency cloud service users (especially users with heavy computational demands) were experiencing. We found that RIPE Atlas - an active collaboration tool with distributed network probes over a big part of the world - was ideal to perform this study.
By carrying out a three month traceroute study from cloud probes to other network probes spread over Spain, we were able to see that most of the cloud users in Spain (a medium-size, developed country) can reach the cloud with a round trip time of 50ms. While this performance is ideal for some services, it cannot adequately address all the needs of emerging technologies such as augmented reality or unmanned aerial vehicles, and the observed correlation of latency with distance strongly suggests that edge-based computing solutions may be required to accomplish the envisioned development of such applications.
We also found that latency to the cloud is relatively unchanged and can be predicted best using time series methods for a few next samples or tree-based methods for larger future cloud samples. We also found that explainable algorithms identified that distance was the most important factor affecting cloud latency.
References
- AWS Local Zones locations: https://aws.amazon.com/about-aws/global-infrastructure/localzones/locations/
- Google Cloud Services: https://cloud.google.com/about/locations#regions
- The detailed methodology and extended results have been presented and published in the conference paper: "Clearing Clouds from the Horizon: Latency Characterization of Public Cloud Service Platforms" for the 33rd International Conference on Computer Communications and Networks (ICCCN), IEEE, in July 2024, by Ingabire, R., Bazco-Nogueras, A., Mancuso, V., Contreras, L. M., & Folgueira, J.
- Traceroute Features https://atlas.ripe.net/docs/apis/measurement-result-format
- Data Science Methodology: https://www.kaggle.com/code/xiuwenbo666/data-science-methodology


Comments 1
Abid Ghufran •
This is a good approach but i think you need to try with a bigger wider scope. Plus you have not mentioned if Telefonica was connecting to these cloud providers directly or across other Transit/Peering providers. Performance across direct network connectivity and across shorter Internet paths (AS hops) is pretty much stable, predictable and usually within acceptable parameters, for most cloud needs. There can be localized stress points but for a true measure, we can probably consider wider intra-regions and an inter-regions as for the scope.