RIPE Atlas data is now available as a live data stream, opening the door to a host of new applications and use cases. Learn more about how this powerful new functionality can benefit your network.
Data Retrieval
Imagine being able to glance at a virtually real-time, continuous visualisation of measurements targeting your network, providing an at-a-glance overview of its health.
That's what we're working to provide with a new interface that makes it possible to "tune in" to live streams of data as it's being collected by the RIPE Atlas network, sort of like listening in to a radio station. By "listening" to these data streams, network operators can access RIPE Atlas data and use it for their own custom purposes.
The data retrieval platform we're using is WebSocket , an interface that allows for a single connection, two-way information exchange between client and server including server side data push. It's a more efficient protocol that can handle large amounts of data, and is a big part of what made it possible for us to provide virtually real-time data.
RIPE Atlas users can retrieve data streams both for the built-in measurements run by the RIPE Atlas system, as well as for their own customised measurements.
You can read more details about technicalities on our documentation page .
Data Visualisation
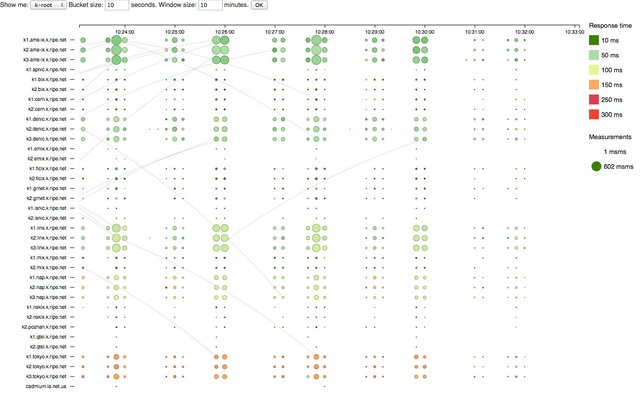
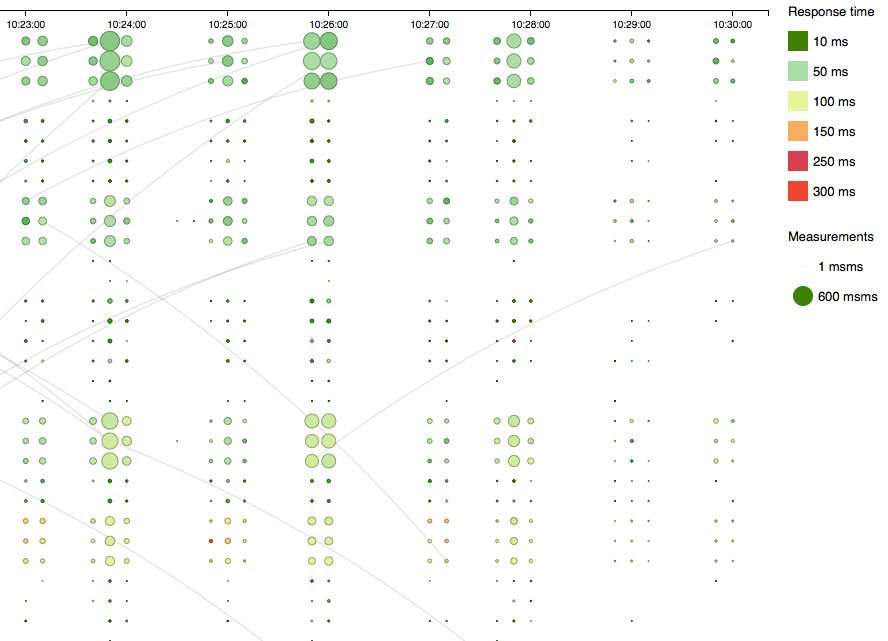
We've also created a data visualisation for measurements targeting the root name servers . You can see response times for different instances (represented by colour), as well as how many measurements are targeting each instance (represented by circle size). The information is presented as a scrolling data stream, and you can filter for bucket size and window size.

In the future, we plan to make more data visualisations available for other measurements (see more under Next Steps and Feedback ).
Network Monitoring
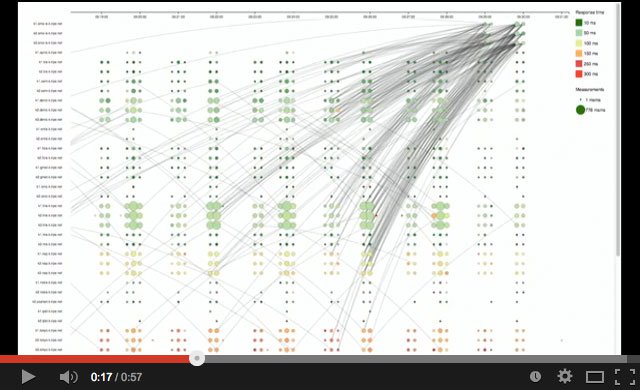
When AMS-IX, the Amsterdam Internet Exchange, recently renumbered their AMS-IX Peering LAN , the new DNS data streaming visualistion captured the resulting change in targets. You can see a video of the data stream below.
The video (which was sped up to run at ten times faster than real time) shows when the K-root AMS-IX instance was turned back on. The appearing lines show probes switching from other instances to AMS-IX on a massive scale. During normal operations, you don't expect such an event; therefore such a real-time visualisation is an example of how the new data streaming platform can be used to see expected results of a planned event. It is equally useful when used to monitor your network for any unexpected service disruptions.
Next Steps and Feedback
This service is in prototype status . We're observing how our system reacts to the streams provided to users in order to evaluate the feasibility and usefulness of a production service.
We plan to make more data visualisations available in the near future, including demos for visualising various RIPE Atlas measurement types (ping, traceroute, DNS, SSLCert). Our intention is to create a library of such visualisations, encourage our users to enhance the existing modules, create new ones and share them with the RIPE Atlas community.
You can find out what we've recently done, what's currently being developed and what's coming up in the RIPE Atlas Roadmap .
We always want to hear what you think about our plans for future development. Here's how you can get in touch with us:
- The RIPE Atlas mailing list is followed by RIPE Atlas developers
- For specific problems, please open a ticket
- Join the discussion on Twitter: @RIPE_Atlas


Comments 0
The comments section is closed for articles published more than a year ago. If you'd like to inform us of any issues, please contact us.