
On 6 June 2012, the Internet Society organised the World IPv6 Launch. On that day, participants switched on IPv6 not just for testing, but to use permanently in production services. As ten years have passed since, we look at how IPv6 adoption and deployment has progressed, in terms of routing, end-user capabilities and traffic.
IPv6 Routing Table growth
The RIPE NCC has been collecting BGP routing data with the RIS project since late 1999. In November 2002, the first IPv6 peering sessions were established on the collector at AMS-IX, Amsterdam. At that time, a default free IPv6 routing table had about 300 prefixes. By the time of world IPv6 launch in 2012, this had grown to 9,500. And now, 10 years later, RIS sees a total of 155,000 IPv6 routes; a growth close to 1600%. Alongside that, the IPv4 table has grown by roughly 140%, from 410,600 to 935,500. Figure 1 shows the development of both IPv4 and IPv6 tables in the past 10 years. Note that in the many peering sessions, RIS also picks up a significant number of routes which are not announced on the global Internet, but are meant to stay local; internal to a peer's autonomous system, at best only shared with customers. To estimate the number of routes circulating in global default free routing tables, we restrict the RIS view to those routes which are seen by at least 10 peers.

Although the IPv6 table grew faster in relative terms, especially in the most recent years, the IPv4 table still has six times as many entries. However, the gap in deployment, as seen from the perspective of routing tables, is not as big as it may look at first glance. The RIRs' IPv6 allocation policies are strongly guided by aggregation principles. Organisations receive blocks that are, in many cases, large enough to cover all their future addressing needs. In contrast, with IPv4, the soft landing policies in the run-up to full depletion have led to ever smaller allocation sizes; the total number of allocations and assignments by the RIRs now is 2.5 times higher for IPv4 than it is for IPv6. Even once all networks have deployed and announced IPv6, we can expect the routing table to be smaller than that for IPv4.
A more interesting statistic is the development of the number of more specific routes ('specifics' hereon), entries for which the prefix is covered by a larger covering aggregate in the routing tables. These entries are created for a variety of reasons, which are beyond the scope of this article. But in general the presence of more specifics in IPv6 is a confirmation that the resource holder is doing more with his IPv6 address space than a token announcement in BGP. (the opposite does not hold, of course; an operator who does not announce more specifics may very well have deployed IPv6 throughout his network; it's just that, from the perspective of the routing tables alone, we cannot tell).
The blue lines in Figure 1 show the growth of the number of more specifics in the past 10 years; for IPv4 and IPv6. In IPv6, some discontinuities stand out; sharp increases which after some time were followed by equally large decreases, back to the original trend line. These happen when some party announces one or more of the IPv6 blocks IANA has allocated to the RIRs in BGP. In those cases all assignments and allocations made by the RIRs will be counted as more specifics. Merit's darknet experiment which ran from late 2012 through 2013 is a prime example, clearly visible in the graph.

To better compare developments, figure 2 presents the number of more specifics relative to the total number of prefixes in the IPv4 and IPv6 routing tables respectively. For IPv4, we see only modest changes; the percentage of more specifics in the table increased slowly from 51% in 2012 to 55% in 2019 and has not shown a clear trend since. For IPv6, Merit's long running darknet experiment obscures the initial trend, as it artificially pushed the percentage of more specifics above 50%. After that, and ignoring the incidental spikes caused by other announcements of the /12 blocks from which RIRs make the allocations, the trend clearly is up. Starting in 2015, the percentage of more specifics increased steadily and now stands at 60%, higher than observed for IPv4. This is a clear sign the IPv6 Internet is coming of age. Whatever prompts operators to announce more specifics in addition to their primary allocation, they see a need to do it in IPv6 too.
Finally, we can also look at the number of unique Autonomous System Numbers (ASNs) that announce routes in the IPv4 and IPv6 table. Figure 3 shows the developments in the past ten years, both in absolute numbers as well as expressed as a ratio, the percentage of ASNs seen in IPv6 compared to the total in IPv4. We observe opposite trends for the two protocols; in recent years, growth in IPv4 has been slowing down, while for IPv6 it is (slowly) accelerating. And where in absolute numbers IPv4 still has many more origin ASNs, IPv6 is catching up; the number now is some 40% of that for IPv4; or 33% if we exclude the 4,096 ASNs that China's Education and Research Network inserted in May 2021 to announce their newly allocated /20; each ASN originating a single, unique /32 out of the 240a:a000::/20 block.

IPv6 adoption by End Users
The rollout of IPv6 to end users is an important metric that is being tracked by various parties. Announcing IPv6 address space in BGP and providing services, be it IPv6 only or dual stack, is of course a prerequisite, but if the users are not connected to IPv6 Internet, the services will not be used much. Google, Facebook and Akamai all report statistics on the percentage of users who access their services via IPv6. APNIC estimate the number of IPv6 users through active measurements, which are delivered to the user's device via the Google ads framework. APNIC actually provides two metrics; the percentage of users that are IPv6 capable in that they can reach an IPv6-only site, and the percentage of users who, given a dual stack server, will use IPv6. The differences aren't very large though.
Due to the different methodologies, the results differ by 5 to 10 percentage points, Google being most enthusiastic with peaks above 40% adoption during weekends in June 2022, while APNIC's estimate is more conservative with a little over 30% of users in the world capable of using IPv6. The general trend however is similar. Growth accelerated in the years 2014-2017. From 2019, the trend is more linear, but still up. The spread in Google data also increased with the difference between Saturdays and Mondays now as high as 4%. A clear indication that IPv6 roll-out is not spread evenly across networks. Home users appear to have an edge over business users.


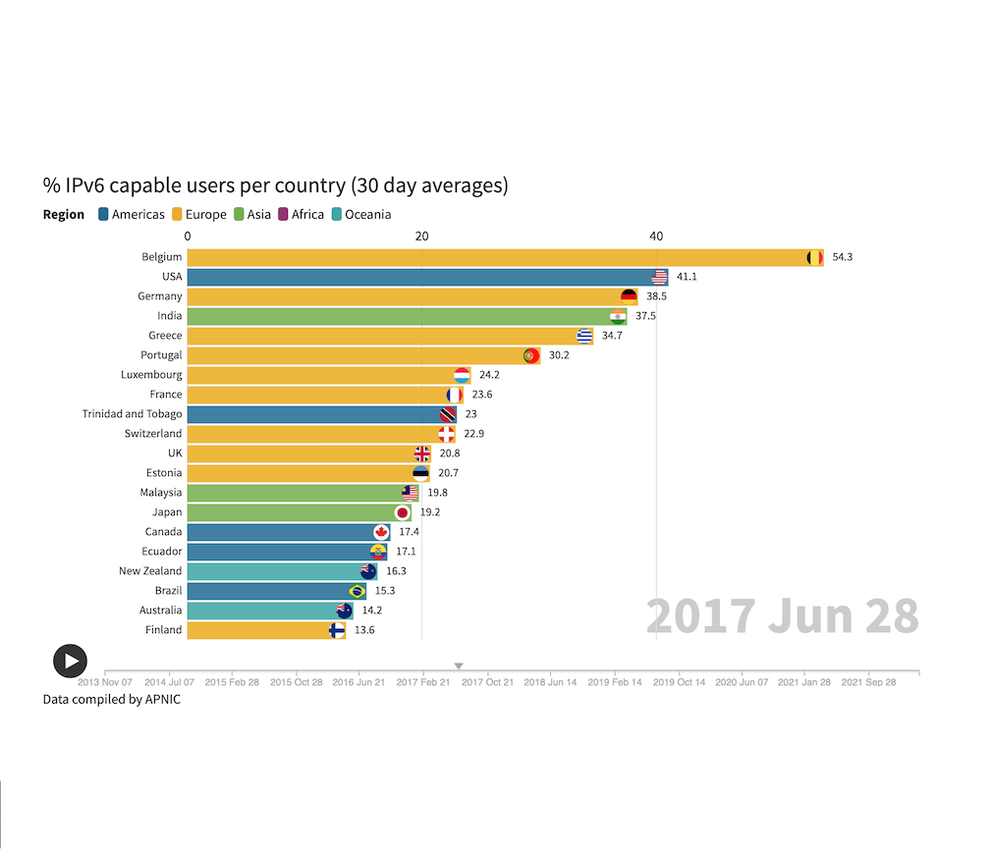
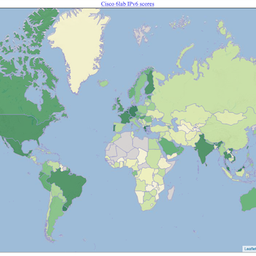
IPv6 deployment is not evenly distributed around the world either. As the map in figure 5 shows, some countries are doing much better than others. Even within a country, deployment can vary significantly between providers. In Italy, for example, APNIC estimate 42% of Fastweb's and 94% of Sky Italia's users have IPv6. However, as other major providers have little to no users on IPv6, the country's overall score stands at 6%, well below the world average.

The strong dependency on individual providers also makes that in the past 10 years the leader board of countries that have advanced most with IPv6 deployment for the end users has seen constant changes. The visualisation below highlights this with historic data from APNIC. We can see how countries that once ranked in the top 20 thanks to the action of some pioneer ISPs have by now fallen behind. As other ISPs did not take action, the overall score of the country stalled or progressed much more slowly compared to other countries. This demonstrates that it takes a concerted effort of access providers and hosting providers to boost IPv6 adoption on the country level above 50%. And to reach 90%, many of the organisations that connect a smaller part of the user base need to act too.
This IPv6 adoption bar chart race was created with Flourish.
IPv6 traffic
Where the increase in routing table entries shows more organisations are connected to the IPv6 Internet and the increase in roll out to end users shows more people are capable of using the IPv6 protocol, traffic measurements tell us how much the protocol is actually used. Intuitively, we can expect IPv6 capable users to use IPv6 when interacting with the large content providers and content delivery networks which all have IPv6 enabled. Global measurements of this traffic are not publicly available, however, as the vast majority passes through private interconnects. Only incidentally do parties release the information; usually when some milestone is reached, a new record set. At the occasion of the World IPv6 Launch anniversary, for example, Akamai reported their peak IPv6 traffic had increased from 1Gbps in 2012 to 41,000 Gbps in 2022.
Only a small part of total traffic passes over Internet exchange point LANs; in a blog post from May 2021 Equinix puts it at 10%. Although statistics on this traffic aren't necessarily representative for global developments, on a multi-year time scale IPv6 traffic is on the rise in these settings too. On the Amsterdam Internet Exchange, IPv6 traffic hovered around 3 Gbps in June 2012. Ten years later, in June 2022 it reached daily averages of 390 Gbps and 5 minute peaks of up to 500 Gbps.

However, IPv4 traffic also increased significantly in the past decade. In May 2022 Akamai announced they had set an all time high of 250 Tbps of web traffic delivered across the edge network. The 41 Tbps peak in IPv6 corresponds to 16.4% of that. These may well have been different events, different reasons why traffic peaked, but the ratio between the two peaks is much lower than one might expect from end user IPv6 capability levels measured by Google and APNIC. On the Internet exchanges, the observed percentages of IPv6 to total traffic are even lower. For June 2022 AMS-IX observes an average of 4.1%.

In London, LINX sees similar levels in their flow statistics On the LON1 exchange LAN, the location which by far has most traffic passing through, on average 3.7% of the traffic is IPv6. Comparing the maxima, this rises to 6%, still significantly lower than Akamai's numbers and even further away from global end-user adoption rates measured by APNIC, Facebook and Google.

It is hard to tell what exactly is happening here. Statistics on sources, destinations and traffic volume between pairs of these are not available, for obvious reasons. But given the levels of end user IPv6 capabilities and IPv6 preference in case of dual stack servers, a conclusion might be that IPv6 adoption is lagging on the side of the various destinations.
Conclusion
In the past decade adoption of IPv6 has made significant progress. The routing data collected by RIPE RIS sees more IPv6 entries, more ASNs that announce IPv6 prefixes and a ratio of more specifics that now is on par to what is observed for IPv4. IPv6 adoption at the end user side is measured to be between 30% and 40% globally, though with large differences between regions and countries. IPv6 traffic is on the rise too, both in absolute numbers and relative to IPv4. However, in statistics from Akamai, AMS-IX and LINX the fraction of IPv6 traffic is two to six times lower than what one, naively, might expect from the deployments to the end users. IPv4 still seems to be the dominant protocol in these environments. At the RIPE NCC, we are eager to see how all these aspects will develop in the next 10 years and will continue to follow this closely.
Comments 1
The comments section is closed for articles published more than a year ago. If you'd like to inform us of any issues, please contact us.
Geert Jan de Groot •
Thank you for your analysis. I do have a few points to make though. IPv6 was originally defined to solve address space issues with IPv4. So, on the Internet, we would add IPv6, run dual-stack, and when everybody has IPv6 access, we could stop providing services via IPv4. When we're talking about IPv6 deployment, that should be the goal, and how are we faring? One way to look at this is mobile access, that is access via smartphones. Many, many people have smartphones and for many it is the primary or even the only network access device. Looking at this, the situation is much less favorable. Mobile devices that have wifi access - if the wifi provides IPv6, then many (but not all) devices will use it. In some case IPv4 is preferred, in some cases IPv6 is. Providing and analyzing the guest network of a youth organisation is interesting in this regard. But the real problem is that IPv6 is almost never made available over mobile (4G / 5G) networks. I am not able to buy a mobile subscription that provides IPv6 in the Netherlands, and I think this applies to many EU countries (would be interesting to investigate!) From what I have been told (and please correct me!), providing IPv6 connectivity incurs an additional chargeable connection slot at the mobile network infrastructure, incurring additional cost. If that is true (again, I don't know!) then providing IPv6 makes no business sense since the operator is doubling his connection cost w/o clear benefit. There would be a clear benefit if all providers do this (forced to do this) because in this case all providers incur the same cost and hence the cost would be "zero", at least from an intra-provider competition point of view. This would be of great benefit for one's national economy because we could start working on the next phase, plan to phase-out IPv4. So, I asked. When the auction process for 5G spectrum space was done in the Netherlands, I suggested that the 5G service would be dual-stack as part of the bidding process. This suggestion was denied; the regulator commented that the service should be "technology-neutral" and hence didn't feel like supporting IPv6 as part of the 5G service. I think this would be interesting successive work. One, find out if, where and how IPv6 connectivity is made available in mobile networks (I'm only aware of Slovenia doing this). And two, as long as regulators don't see the advantage of doing IPv6 as a solution to the problems of address space scarcity on one's national infrastructure, I think there is some work here. Perhaps an organisation like ISOC could consider this work, sort of as a next phase of the IPv6 deployment initiative. It is possible (though some providers find it surprisingly difficult) to make one's consumer home-network dual-stack. But without involvement of mobile access IPv6 remains a "server only" thing. And that's not what we had in mind when the IPv6 thing started.