We started beta-testing User Defined Measurements (UDM) for RIPE Atlas. The first results are encouraging and we are receiving useful feedback from happy users.
As announced in New RIPE Atlas Features in the Making , we started beta-testing User Defined Measurements (UDM) in RIPE Atlas. Our strategy is to start with a basic set of measurement parameters that can be set by the user, and enable more features over time.
To be able to control the "resources" (i.e. how many measurements each probe can do), we introduced a "credit system", in which each user gets some resources as credits, and can spend them on measurements he or she likes to perform.
On 22 November 2011, with started testing the system with a group of around a dozen beta-testers. The beta-testers are very active and there are lively and constructive discussions on the RIPE Atlas beta-testers mailing list. We received a lot of useful feedback, and the developers are very responsive in creating new features and answering questions.
"What an interesting playground!"
Please see below some quotes we received from beta testers on the list:
- To all the RIPE NCC guys: keep up the good work, Atlas is a really nice project :)
- And the best part is that you can actually be part of it so easily!
- For now I'll provide a resounding "thanks" for the work; this is looks amazing so far .
- Thanks a million for implementing the Participants GeoLoc map!!
- [The credit system] works like a charm, its clear how much you have left as well as how much you've spent, and there's plenty of credits for your measuring pleasure.
And some additional features were requested, too:
- I would also say that an extra "description" field for the UDMs can be very useful to identify your (and anybody else's) transient and exotic measurements, which are hard to identify numerically otherwise.
- Can you change the behavior of "NEWLINE" to have "Last message repeated N times", just like some syslog implementations do.
- May I ask for inclusion of the IP[v4|v6] address in the graphs next to the DNS name, just like in the graphs for the built-ins?
- I'd like to be able to define a "dual-stack" UDM.
A peek behind the curtains
In the image below, you can see how I set up my first UDM - easy and simple.
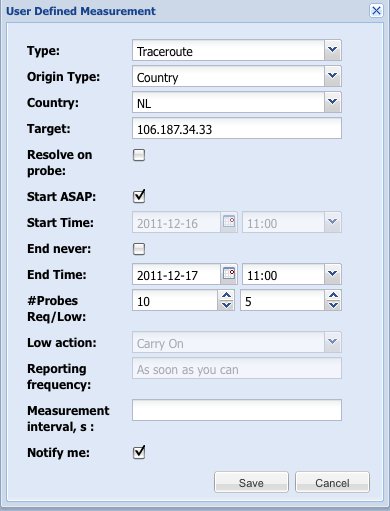
I have chosen an example question that was posted on the NANOG mailing list last week: Someone reported that a certain website was not accessible from his location, and he was asking people to send him traceroutes from various places around the world. RIPE Atlas can do this for you without "help from your friends"!
In the UDM interface, you can choose where you want the 10 random source probes be located: per country or per continental geographical area. Other options that can be set are start and end time, and if you want this to be an IPv4 or an IPv6 traceroute.
In another menu, you can view all the UDM measurements you set. Note that in the image below there is only one line, because I only defined one measurement (you can click on the images to enlarge them).

My traceroutes were scheduled to last for one day, and below you can see the results:
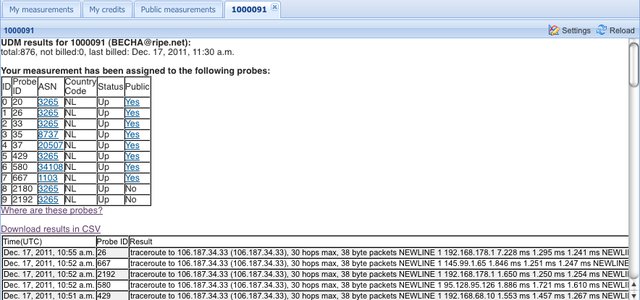
I can see which probes were randomly selected to take part in my measurements, which AS they belong to and then go to 'download results'. It is possible to click on each probe and then go directly to the results for that specific probe (if they are marked "public" by their host; "private" probes also contribute measurements data, but only in an aggregated way). It is also possible to click on an AS number. That automatically opens RIPEstat and shows the information for that particular ASN.
The type of measurement I specified was 'traceroute', so the results are presented as text in the table. The screenshot shows how this looks like in the browser. You can also get a CSV file or the raw data.
In this example, I did some manual analysis:
- I've scanned the file for multiple occurrences of "*"
- I looked at the final time in which various traceroutes finished
- and looked for anomalies.
This particular measurement did not give me many interesting results, but in case of a real problem (as in the original NANOG post), it could have been a very useful tool for diagnosing where the disturbance is happening.
The interface also provides a link to a map that shows the location of the probes that did the measurements:
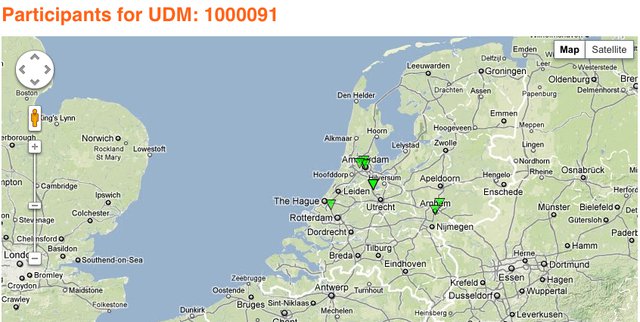
Since I specified NL as source for the traceroutes (see Figure 1), the map shows that all the probes that participated in this measurement are located in the The Netherlands.
Multiple pings on the same graph
The graphs below show some results from fellow beta-testers: you can see how multiple pings are presented on the same graph. Under the graph you can see colour of each probe. Depending on how many probes you select for the measurement, you get a more or less readable graph. With all 10 possible probes (as shown in Figure 6), the graph gets quite crowded!


For more details on UDM, please refer to the presentation given by Róbert Kisteleki in the MAT-WG at the RIPE 63 meeting in Vienna.
Next steps
Our RIPE Atlas developers are now implementing some of the requested features and ideas based on user feedback. New releases are constantly added to the existing UDM functionality.
We are still accepting applications for the second round of beta- testers: please write to " atlas-dev@ripe.net " if you want to join.
Our plan is to make UDM available to all the RIPE Atlas probe hosts early in 2012. Stay tuned!




Comments 0
The comments section is closed for articles published more than a year ago. If you'd like to inform us of any issues, please contact us.