
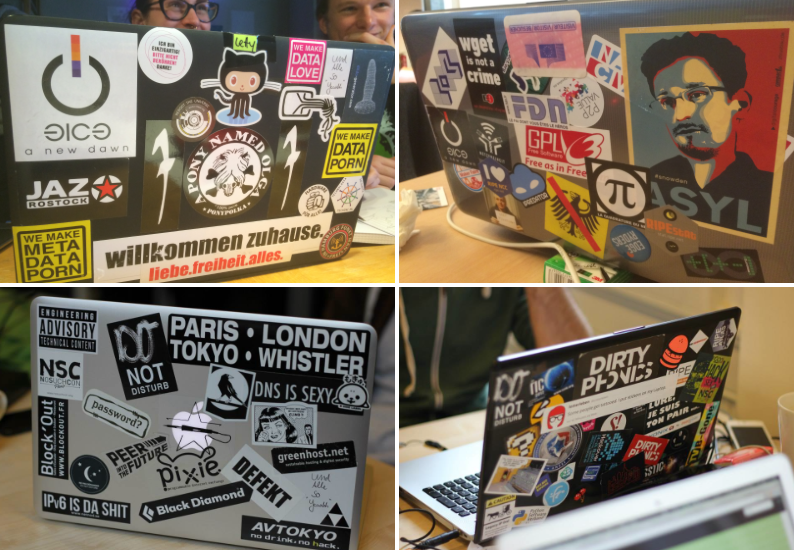
In March 2015, a diverse group of contributors got together to come up with creative ways to visualise the health of the Internet using RIPE Atlas open measurements data. It was the first RIPE Atlas hackathon. Impressive results were hacked together by programmers, designers and operators during an intensive weekend of work and fun in Amsterdam. In this article we celebrate hackathon achievements, document and promote hackathon results, create a memento for participants and report in detail for the benefit of the rest of the community.
Table of Contents:
- Introduction
- Before the storm
- Starting with a bang
- Hackathon results
- Prizes
- Conclusions
- Lessons learned
- Links to all presentations and code

Introduction
The first RIPE Atlas hackathon was a chance for developers, designers, computer science students and open data enthusiasts to access the large open datasets provided by RIPE Atlas, a global Internet measurement network that measures Internet connectivity. Hackathon participants were challenged to use this open data to develop useful, creative and stunning visualisations for the benefit of the entire Internet community. They could further develop existing ideas or create entirely new visualisations. The aim was to have completed tools or working prototypes for all-new data visualisations. And there were prizes to win, too!
Numbers
- We received more than 70 applications for participation
- Present: 24 participants (& one no-show), 6 jury members and 11 support staff (coincidentally: 42!)
- Six out of 25 participants were female (24%)
- Three jury members were female (50%!)
- Ten final projects were presented
- Four projects were awarded prizes
- 14 free & open source software projects were published on GitHub
- 20 litres of tea were consumed
- Ten large pizzas were eaten for lunch on Saturday
- Two kilograms of chocolate Easter Eggs were munched up
- 12 Club-Mate bottles were emptied
Links
- All code can be found on the RIPE Atlas community pages on GitHub
- Photos from the hackathon
- Videos: part 1 and part 2 and a time-lapsed impression of one of the sessions
Before the storm
More than 70 applications were submitted, and the jury had a difficult time choosing among the very good candidates. The jury payed attention to the complementary skill sets, as well as gender diversity. Most participants came from Europe, particularly Amsterdam, since limited grants for the travel allowance were available. Finally, 25 participants were accepted, due to space constraints and the logistics of "herding so many cats".
The first day of the hackathon took place at the local hackerspace Technologia Incognita . The next two days took place at the RIPE NCC offices.
Since this was our first hackathon, we had a lot to learn about organising it, and we did not know what to expect. We experimented with ways of announcing it, contacting appropriate audiences, looking for venues, choosing dates, using different communication channels, preparing material for the participants and studying examples of other hackathons. All this advance planning and attention to organisational details paid off, because we were very much ready for it when we finally dove in :-)
Starting with a bang
At noon on Friday, we got together in the hackerspace for introductions to one another and to RIPE Atlas, and to form the teams and brainstorm initial ideas.

Well, at least that was the original plan...but then there was a massive power outage in parts of Amsterdam and the airport, which affected flights and public transport, so several people were stranded. Conveniently, this gave us real-time power outage data as captured by RIPE Atlas probes, documented in a RIPE Labs article

On Saturday and Sunday, participants worked together in teams to further develop their ideas, culminating in short presentations to the jury on Sunday afternoon and a party to announce the winning teams and celebrate everyone's participation. Food and drinks were provided throughout, allowing for more team-building and brainstorming during mealtimes.

Hackathon results
Below we briefly present the final results of all teams and individuals in random order.
1. Traceroute Consistency Check (by Valentino Di Donato)


Traceroute path change visualisation
2. Spotting Anomalies Using R (by Luuk Hendriks, Barbera van Schaik and Larisa Blazic)
By using statistical tools and a data analytics approach, this team visualised the asymmetry in IPv4 vs. IPv6 measurements towards RIPE Atlas anchors, and experimented with the RIPE Atlas streaming API in order to detect interesting events.

3. Spatial Bucketing of RIPE Atlas Probes on Map Projection (by Julian Hammer)

Julian wanted to solve the following problem: when scheduling measurements from lots of probes, requesting a "random worldwide selection" currently results in a choice that is very biased towards Western/Northern Europe and the USA (see image without Sbucket on the left).

Julian's solution makes a more equal selection, by using the grid to divide the globe an d choose probes based on that division (see image on the right after applying Sbucket). It also offers alternatives to the Mercator projection .
The code can be found on GitHub: RIPE Atlas Sbucket
4. AnyAtlas (by "The Martins", a.k.a. Tom Levine, Caleb James DeLisle, Martin Levy, Shane Kerr and Evan Thompson)
This team used RIPE Atlas to measure latency and the responding node name from an anycast DNS deployment. They then compared it with the speed of light in fibre, in order to determine the difference between measured and theoretical minimum latency. There was also a musical interpretation of data, but not enough time to show it. The code can be found on GitHub: RIPE Atlas anycast and RIPE Atlas anycast work .


5. RIPE Map (by Michael Kreil and Katja Dittrich)

The code can be found on GitHub: RIPE Map .
6. Disco - Appetite for Disconnection (by Merlijn Tishauser, Nana Klok-Manojlovic, Anna-Kaisa Pietilainen and Igor Rinkovec)

This team combined multiple data sources: live RIPE Atlas data showing disconnection events with a Twitter feed and weather information, specific to a zoomed-in area of interest. On the left you can see a heat map visualisation of disconnected probes.
The code can be found on GitHub: RIPE hackathon disco .
7. BGP+traceroute (by Jelle Herold)
This work was a combination of RIS & RIPE Atlas data that maps traceroute measurements towards anchors and correlates this data with ASN information. There are similarities with Valentino's work, as these participants collaborated in the first phase of their creations. The code can be found on GitHub: BGP Traceroutes.

8. Zeerover DNS (by Matt Calder and Ruwaifa Anwar)
This project answers a need of the research community: to measure "the whole Internet". That means multiple destinations in the same measurement (while RIPE Atlas is more suitable for periodic measurements towards the same destination from multiple vantage points). The hack converts IP addresses of those multiple destinations into the unique hostname, schedules the "normal" measurement towards that hostname, and configures a "zeerover" (Dutch for "pirate") DNS server to point probes to different IP addresses. This was inspired by, and loosely based on, scapy-dns-ninja . The code can be found on on GitHub: Zeerover.

9. BGP Atlas Monitor "BAM!" (by Guillaume Valadon, Francois Contat, Mathias Handsche and Thomas Holterbach)
The goal of this project was to display - in real time - information that is useful for network operators, such as the visibility of prefixes as seen from RIS, or ping delays as seen from RIPE Atlas probes. The code can be found on GitHub: BAM!


10. Probe Streams (by Vinayak Hegde)

The probe streams visualisation by Vinayak Hegde
This is a beautiful graphical display of the RIPE Atlas probes landscape over time. It shows the distribution of the probes per country or per continent. The code can be found on GitHub: Probe Streams .
In order to present the results of this project, we had to "hack" the recording/presentation setup, because we were missing an HDMI converter. What a wonderful ending to the hackathon!
Prizes
All participants receive RIPE Atlas t-shirts, but when it came to awarding the big prizes, the jury had a hard decision to make. There were three monetary prizes awarded, courtesy of Comcast.

After a short deliberation, the jury agreed on the winners and announced them at the closing party:
- Third place was shared between two projects working on traceroute visualisations: Valentino & Jelle
- Second place was given to sBucket by Julian
- First place went to Team Disco
Congratulations to all the winners!
DISCLAIMER: The monetary part of the first place was shared between three team members, because Nana Manojlovic is a family member of one of the RIPE NCC staff members and was therefore not eligible.

Conclusion
The hackathon was a great success. The dynamics among the participants were really positive and everyone had a wonderful time. On top of that, each of the 10 teams produced impressive and highly useful results. Some of these results can quite easily be integrated into RIPE Atlas with little further development.
On behalf of the community, we are grateful to Comcast for sponsoring prizes and travel expenses. We also thank the hackerspace Technologia Incognita for the inspiring location on Friday.
On behalf of the organisers, we are grateful to everyone who took part and contributed, as well as to their family and employers, who let them get away for the weekend to combine work with fun.

Lessons Learned
- Hackathons work!
- Connecting a group of people who have never met before and introducing them to a tool that they might have not seen before, creates amazing results.
- Invest less in preparation of logistics, more in educating participants (for instance via a webinar).
- The motivation for most people is a sense of accomplishment, having fun, making connections and learning.
- Idea for the next hackathon: monetary prizes might not be necessary to accentuate our intention on fostering cooperation rather than competition.
- Longer hacking days (and nights) are needed.
- Set aside a shorter lead-time between the announcement and the event itself.
- Invest energy in reaching out to a wider audience - more designers, students and scientists as well as operators.
Future Plans
- RIPE NCC: use the feedback, feature requests and the resulting code to improve RIPE Atlas
- Participants: improve the software produced
- Promote the winning teams at the RIPE 70 Meeting in Amsterdam in May 2015
- Publish more in-depth articles about the hackathon contributions on RIPE Labs
- Have another hackathon!
Keep in Touch
- Mailing list: ripe-atlas@ripe.net
- IRC: irc.freenode.org #ripeatlas
- Twitter: @RIPE_Atlas
- Check out the RIPE Atlas community pages
Comments 0
The comments section is closed for articles published more than a year ago. If you'd like to inform us of any issues, please contact us.