"Measuring the Internet" has become an increasingly essential practice in many different areas. The fact that we are living in an era where Cloud services and CDNs are becoming more accessible and worldwide presence is within hand's reach for practically anybody, making informed decisions through measurements can both save money and help to find optimal performance.
In 2015 we did a study on the coverage of RIPE Atlas and ProbeAPI and compared their worldwide presence in terms of numbers of probes and users. We still needed to know the practical implications of the design and implementation of these two different platforms, which serve very similar purposes. In this article, we show the results of two parallel measurements made simultaneously with RIPE Atlas and ProbeAPI.
Comparing the Platforms
RIPE Atlas uses hardware based probes. There are normal probes and RIPE Atlas anchors, the latter being special probes that provide extra measurement capabilities and which can, among their other features, act as measurement targets. The hardware and software of RIPE Atlas probes is mostly homogeneous, differing only in versions.
ProbeAPI consists of pieces of software running on users' computers (Win32/64). This means that different hardware and software configurations, as well as the host machine’s usage, will affect a probe’s availability and, possibly, measurement results. QoS engines and custom firewalls can blur measurements from one perspective, while at the same time offering precisely the view of a random user within the parameters of our selection. This is worth considering if we want to measure the full network stack with HttpGet or DNS.
| RIPE Atlas | ProbeAPI |
|---|---|
| Hardware is homogeneous and therefore has more predictable behaviour. | Hardware is heterogeneous and therefore has more unpredictable behaviour. |
| Connections are more stable due to independence from user hardware. | Connections are more unstable due to dependence on user hardware and its usage. |
| Not bound to a host OS and its limitations/vulnerabilities. | Bound to a host OS (Windows) and its limitations/vulnerabilities, but also a good vantage point for application level troubleshooting. |
| Distribution is more costly and slower. Some regions are really difficult to cover. | Distribution is cheaper and faster. Distribution via software has helped to cover otherwise difficult areas. |
| HTTP measurements only available using anchor probes as targets. Measurement methods are limited due to security reasons. | HttpGet, DNS and page-load using Mozilla and Chromium libraries are available for any public target. |
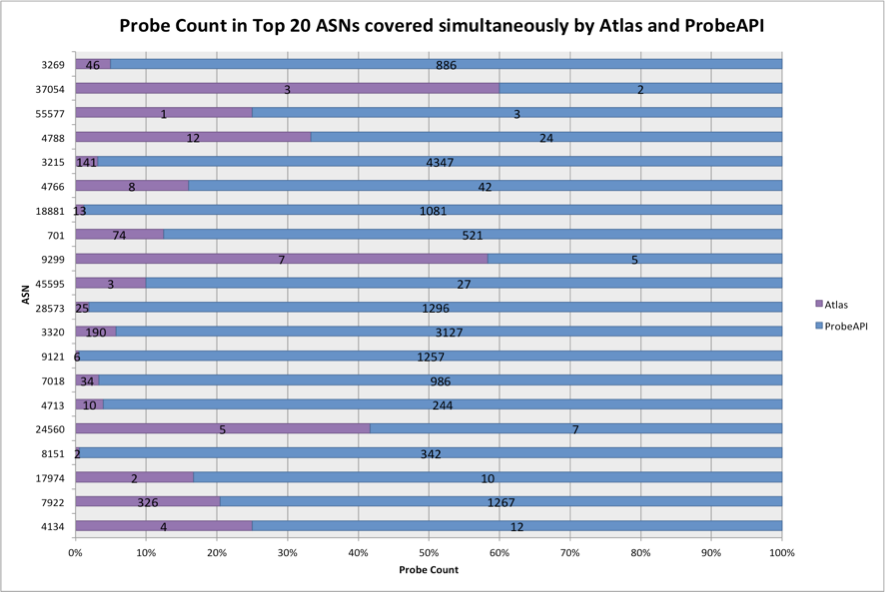
Both platforms show good coverage mainly in the US and central Europe, with Germany being a notable example. ProbeAPI generally has a much higher probe density in most areas, but those probes appear and disappear from the network relatively often (higher volatility). In the next graph, we can observe the number of probes for both platforms covering the top 20 ASNs with the most users. This is taken from a study we conducted in 2015 in collaboration with LACNIC.
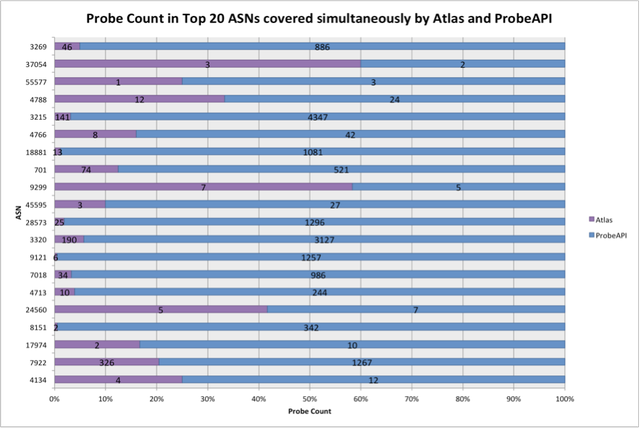
Figure 1: Number of RIPE Atlas probes (purple) and ProbeAPI probes (blue) in the top 20 ASNs
Currently RIPE Atlas has around 9,500+ connected probes, and the number of ProbeAPI online probes oscillates around 100.000+. Follow this link if you want to read our full article on the coverage of RIPE Atlas and ProbeAPI.
HTTPs measurements are available on both platforms. ProbeAPI includes HttpGet, DNS and PageLoad. These methods provide us with three application layer vantage points from which we can evaluate connections. In the case of RIPE Atlas, HTTP measurements will work only with anchor probes as targets, which include HTTP servers and a well defined set of small testing pages. Due to the public nature of RIPE Atlas, these restrictions make sense and are thought to benefit the community, while also avoiding conflicts with internet content regulations in different countries. A careful implementation of HTTP measurements for general use is in course (for more information on HTTP measurements using RIPE Atlas, read this article).
Measurement Setup and Results
The experimental setup consists of a composition tool that allows us to specify and send equivalent measurement requests to both platforms at the same time. We sent one ICMP request every 60 seconds for one hour to test pages cached by Akamai endpoints in order to avoid long routes. We used 15 RIPE Atlas probes and 25 ProbeAPI probes per measurement. This was to ensure an equivalent number of results for both platforms given that ProbeAPI experiences higher probe volatility than RIPE Atlas. In summary:
- One ICMP measurement per minute repeated 60 times on both platforms simultaneously
- One country at a time
- 15 probes per measurement for RIPE Atlas
- 25 probes per measurement for ProbeAPI (due to higher volatility)
- 10% of slowest results were discarded on both platforms
As we can see in the following graph, some countries show a very noticeable difference when measuring with one or the other platform.
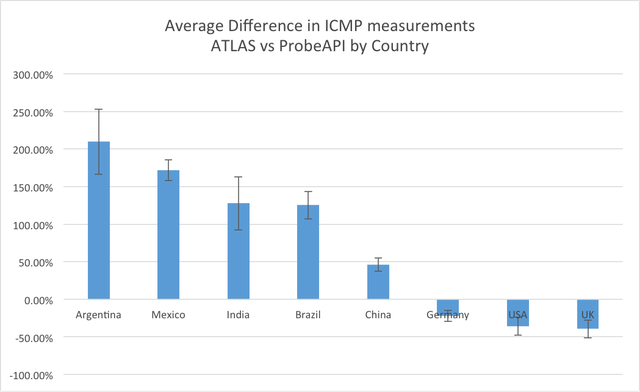
Figure 2: Average difference in ICMP measurements by country
| Countries | Average Difference | Standard Deviation |
|---|---|---|
| Japan | 1179,59% | 269,96% |
| Argentina | 208,82% | 86,84% |
| Mexico | 171,66% | 27,35% |
| India | 127,64% | 70,65% |
| Brazil | 125,17% | 36,38% |
| China | 46,15% | 17,45% |
| Germany | -22,42% | 14,60% |
| USA | -35,84% | 23,64% |
| UK | -39,43% | 23,93% |
In the table above we also include Japan, which was left out of the previous graph due to the very high difference between measurements on both platforms.
In the following example, we can observe that in Argentina we have a big contrast in two respects: RIPE Atlas measurements report higher ICMP Ping values, but its measurements are more steady over time. On the other hand, ProbeAPI shows much lower average ICMP Ping times and a less steady curve.
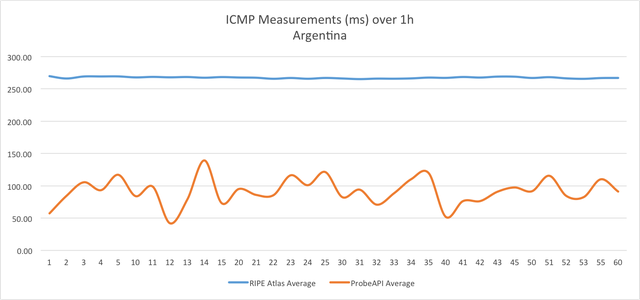
Figure 4: ICMP measurements over 1 hour in Argentina: RIPE Atlas (blue), ProbeAPI (orange)
We think this may be due to a couple of reasons. The first is probe coverage. RIPE Atlas has relatively low coverage in Argentina in relation to its vast territory and high number of users with around 35 active probes. ProbeAPI gets affected in a different way, having around 350 active probes, but with most of them being concentrated in the metropolitan area. Since each measurement is done by a different subset of probes each time, ProbeAPI results have a higher variability, as opposed to RIPE Atlas, where the hardware probes are not only homogeneous but also have lower volatility.
A similar phenomenon can be observed in Brazil, but also more extreme cases are China and India.
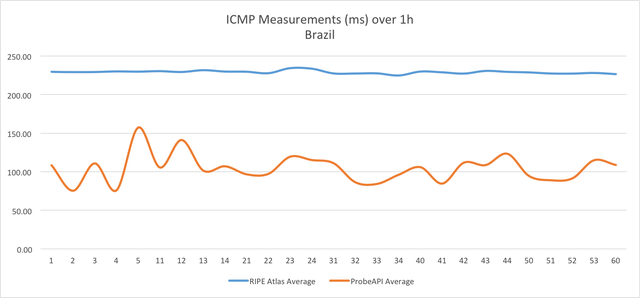
Figure 5: ICMP measurements over 1 hour in Brazil: RIPE Atlas (blue), ProbeAPI (orange)
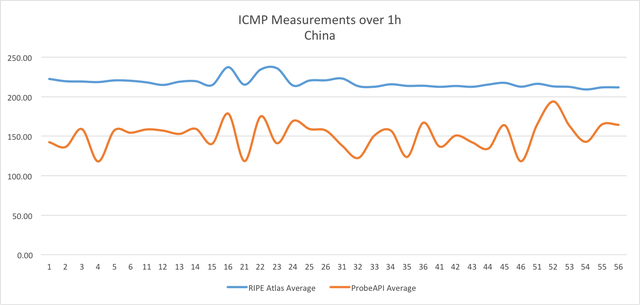
Figure 5: ICMP measurements over 1 hour in China: RIPE Atlas (blue), ProbeAPI (orange)
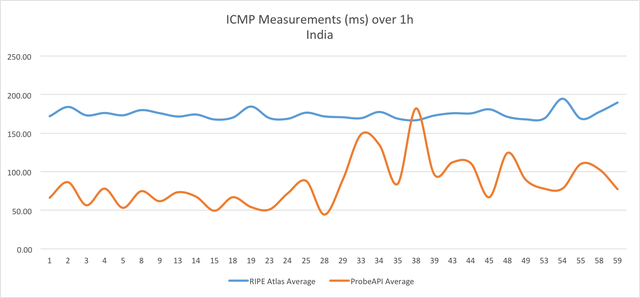
Figure 5: ICMP measurements over 1 hour in India: RIPE Atlas (blue), ProbeAPI (orange)
Mexico shows a steadier behaviour for ProbeAPI, which still measures noticeably lower ICMP Ping times.
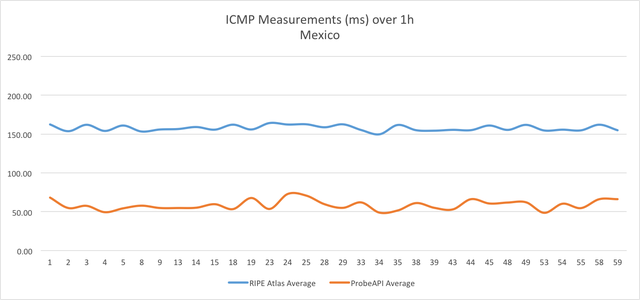
Figure 5: ICMP measurements over 1 hour in Mexico: RIPE Atlas (blue), ProbeAPI (orange)
One interesting case is Japan, which against our expectations measured very high Ping values for RIPE Atlas, while ProbeAPI measured values in a range to be expected when pinging Akamai endpoints in Japan. The reason for this behaviour is unknown to us, since RIPE Atlas has 150 active probes in Japan, which is by no means a low number of probes. It may be that this is still not enough to account for the high number of users in this area, but it is still surprising that those probes reported such high values.
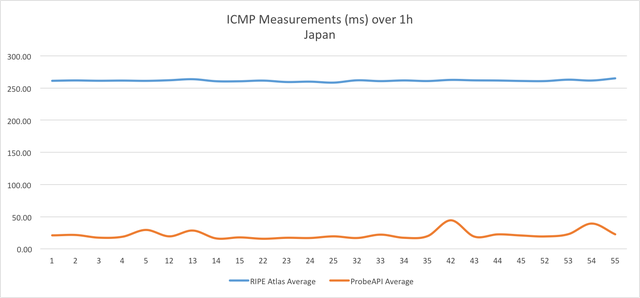
Figure 5: ICMP measurements over 1 hour in Japan: RIPE Atlas (blue), ProbeAPI (orange)
If we now take a look at the UK, the US and especially Germany, we can observe that the behaviour of both platforms benefits from good coverage, with RIPE Atlas showing less variability in time as usual, which translates to higher precision.
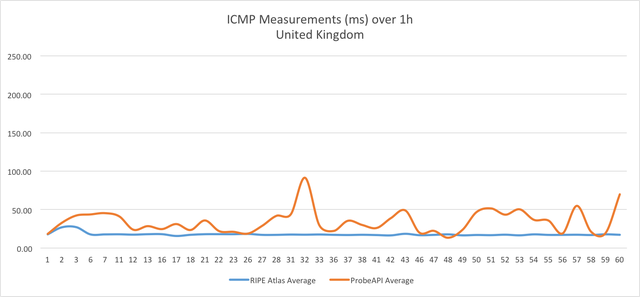
Figure 5: ICMP measurements over 1 hour in the UK: RIPE Atlas (blue), ProbeAPI (orange)
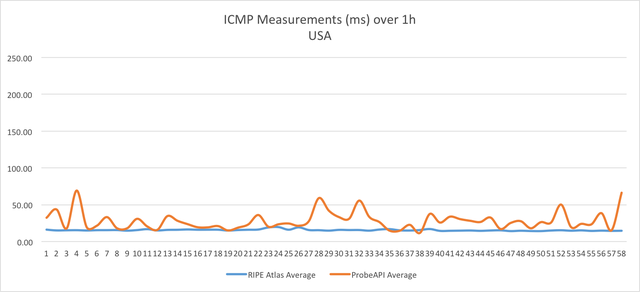
Figure 5: ICMP measurements over 1 hour in the US: RIPE Atlas (blue), ProbeAPI (orange)
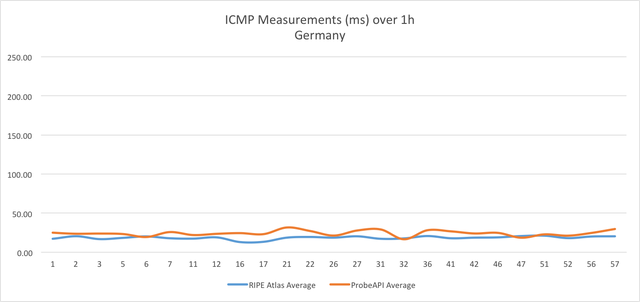
Figure 5: ICMP measurements over 1 hour in Germany: RIPE Atlas (blue), ProbeAPI (orange)
Commentary
As we can see in our measurements, both platforms need to improve their worldwide coverage in order to achieve the very desirable level of confidence of Germany, the UK or the US. It is evident that physical distribution of hardware probes makes RIPE Atlas expansion more difficult. But this is where software probes, with their higher presence, can still help in making useful measurements, despite sub-optimal conditions.
For example, in the LAC region, a very interesting study from LACNIC used ProbeAPI to map this area’s connectivity. It revealed regional connectivity clusters between countries. This information was organised as a connectivity graph, showing intra- and inter-cluster Ping times.
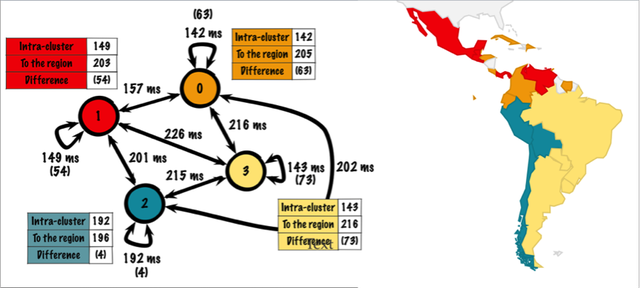
Figure 13: Network graph representing the latency relations between 21 LAC countries
Please find the complete article on RIPE Labs: Connectivity in the LAC Region.
An Alternative Way of Pinging
Some problems can arise when measuring RTT using ICMP. The protocol's potential for abuse has led to its being deactivated on many sites, firewalls and routing devices. On the other hand, being its own separate protocol, ICMP may not reflect the actual behaviour when working on protocols with payload like TCP or UDP. In fact, problems with TCP won’t be visible through ICMP measurements. Following this principle, we could expect similar behaviour across protocols to some extent, but for more certain conclusions we should interpret those results regarding each protocol’s layers and the ones below it. In other words, when measuring with ICMP we are measuring on the network layer (OSI #3) and below.
For that matter, measuring on HTTP has its own utility, since we can not only overcome the problems with ICMP mentioned above, but also measurements themselves will actually reflect the network’s behaviour on the full stack. This way, it is possible to make more specific measurements.
If we repeat our previous one-hour measurement to the same target, but now, using HttpGet, we obtain the following chart:
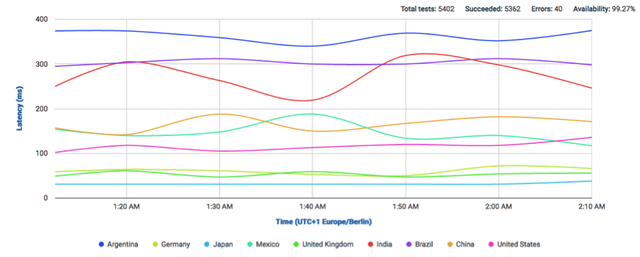
Figure 14: Time To First Byte (ttfb) measurements over one hour
And the median latency:
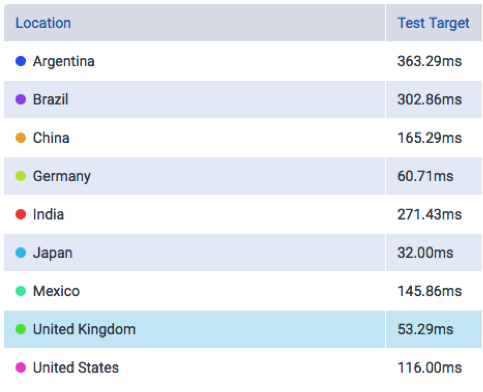
Figure 15: Median Time To First Byte measured over one hour
As an additional example, we measured TimeToFirstByte (TTFB) using HttpGet in Germany and Brazil, retrieving 1,000+ results at once from individual probes all across both countries. Each country was measured using one ProbeAPI call respectively, which delivered a snapshot of the network’s response time.
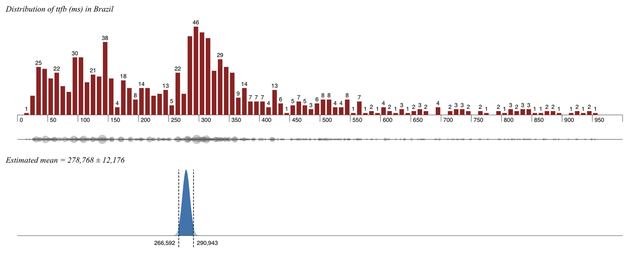
Figure 16: Distribution of measurements in Brazil
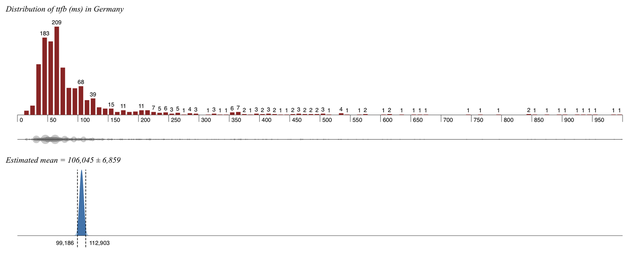
Figure 17: Distribution of measurements in Germany
As we can see in both histograms, Brazil presents a more homogeneous distribution in terms of response time than Germany, which, in contrast, presents most percentiles concentrated on the lower end of the scale. This is reflected by a lower mean with a lower standard deviation as well. This means, of course, that lower response times are much more expectable in Germany than in Brazil. Notably, the measured mean for Brazil (+/-278ms) in this case is close to the one in our previous example (+/-302ms) and to the one measured by RIPE Atlas using ICMP (+/-227ms).
Conversely, since we know the time required to transfer 1 Byte, we can easily convert TTFB to transfer rate in mbps since 1(B/ms) = 0,008 (mbps).

Figure 18: Distribution of transfer rate in Brazil

Figure 19: Distribution of transfer rate in Germany
Here we can observe that Germany now shows a wider distribution on transfer speeds, meaning that measurements were not only more variable into higher transfer speeds, but also that Brazil has a narrower and generally lower transfer rate spectrum. The density maps below the histograms provide a means of visualising how close to each other the results are. Brazil has its users more closely packed together in terms of transfer rate, while in Germany, the grey markings show a lighter colour and scatter through most of the line. All of this indicates that a random user in Brazil will have a lower expected transfer rate and higher response time as opposed to one in Germany.
Conclusion
We compared ICMP measurements made by RIPE Atlas and ProbeAPI, which, being of different nature and design, show interesting contrasts in their results. RIPE Atlas, being a hardware-based network, shows more stable behaviour in its measurements. Results are less variable when the probes are independent from user hardware and therefore remain available for longer periods of time. On the other hand, distribution is much slower and more costly, due to the physical factor of distributing hardware devices and finding volunteers to host them.
ProbeAPI, with its software-based probes, has had fewer difficulties in covering certain areas, especially in the LAC region. However, measurements show a higher variability over time due to less homogeneous measurement conditions and higher probe volatility brought about by dependence on user hardware and its usage.
HTTP measurements have also been discussed, with a brief comparison having been made of features and limitations on both systems. TimeToFirstByte has been presented as an alternative to ICMP for measuring from the top layer using HTTP and its underlying protocols. This is a good illustration of a practical application of surveying features of software probes.
We can conclude that, for network related measurements, RIPE Atlas offers higher stability and precision, being more sensitive to network changes and problems on the server side. In contrast, while ProbeAPI shows higher variability and is less precise on the network level, it has proven to be useful to investigate areas where RIPE Atlas hasn’t reached critical coverage yet.
On the other hand, the utility of ProbeAPI is apparent in its being able to measure from the application layer, and therefore closer to the user, using the same kind of probes for all measurements. This helps to overcome problems with ICMP as well as considering the full stack for a new vantage point. In this case, a heterogeneous set of probes helped us to easily survey TTFB and transfer rates in two countries by taking advantage of their high presence (there being a good sample size of 1,000+ probes in each country).
For future research on this topic, it would be interesting to dive into long term experiments, as well as comparing HTTP measurements with a common target, like an anchor probe or a selected public target. A sensible approach to designing new experiments would be to find out both platforms' boundaries and domains, with special focus on finding potentially synergic applications.

Comments 1
The comments section is closed for articles published more than a year ago. If you'd like to inform us of any issues, please contact us.
Leonid Evdokimov •
> TTFB to transfer rate in mbps since 1(B/ms) = 0,008 (mbps) It looks misleading to me. HTTP TTFB is usually determined by RTT and time taken by the server to generate response. It seems strange to me to estimate bandwidth using TTFB. On the other hand it's possible to estimate bandwidth for low-bandwidth links comparing the latency for the packets of different size. E.g. 1mbit/s link takes ~11ms to transfer 1400 bytes (full-sized ICMP echo).