
RIPEstat has a new widget: Geolocation History. Geolocation History provides information about the physical location of address space over time. This article describes the features of the widget, and explains how the results can be interpreted.
This article was first published on 13 March 2012. It was updated on 5 July 2012 to document the timeline feature .
Introduction
RIPEstat 's Geolocation view displays the geographic distribution of address space for an Internet resource (prefix or ASN). But what if you want to know where the address space was distributed in the past, and how this changed over time? The new Geolocation History widget provides this information for IP prefixes. Support for Autonomous System Numbers (ASNs) will be added soon (Note: since this article was published, support for ASNs has been added).
Earlier we looked at the ASN Neighbours widget in detail. This is the second article in a series highlighting specific RIPEstat widgets by describing their features , exploring how the visualisation can be interpreted , and considering a possible use case .
An explanation of the data sources for a widget can be found under the Info link in the widget (see Figure 1). It is also possible to embed a widget in your own webpage. Details about the widget API are given in the s2e01 demo , while instructions on making use of the underlying data in your own applications can be found in the data API documentation .

Figure 1: Where to find the Info link on an example ( ASN Neighbours ) RIPEstat widget
Features
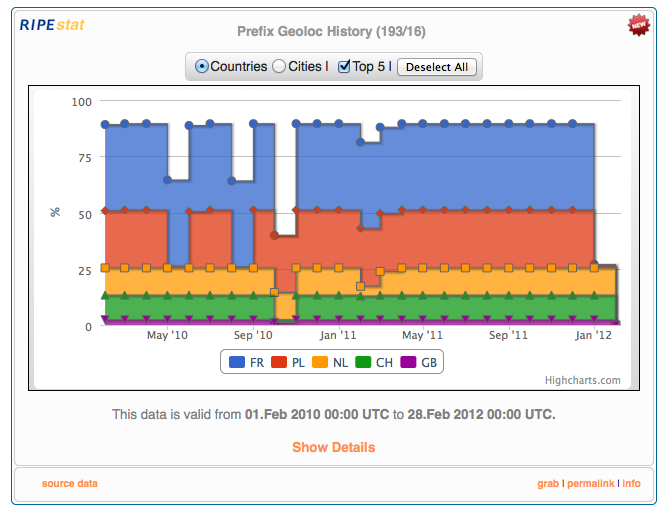
Geolocation History shows where an address prefix was located in the past. Figure 2 shows a typical result. 
Figure 2: A typical result from Geolocation History
There are several ways to modify the default display: switch between cities and countries , see more (or fewer) results , zoom , and table view .
Switch view between cities and countries
If you are interested in seeing the cities where the address space is located, you can select 'Cities' instead of the default 'Countries'. Figure 3 shows a typical view of cities.

Figure 3: A standard city display from Geolocation History
See More (or fewer) results
By default, the number of results is limited to the top five. A more detailed view is revealed when the 'Top 5' option is de-selected. Figure 4 shows this functionality using the same resource as Figure 2 .

Figure 4: Geolocation History country view displaying more results
It is also possible to examine only a subset of the results. Click on the country codes (or city names) from the legend to toggle them. The 'Deselect All' (or 'Select All') option is a short-cut for disabling or enabling all results. Figure 5 shows the effect of disabling one result.

Zoom
If you want to see part of the graph in more detail, you can zoom in by clicking on part of the graph and dragging the mouse until the entire area of interest appears within the shaded rectangle. Figure 6 shows a zoom in progress. Note how the scale is also adjusted.

Table View
Hovering the mouse over a location at a particular point in time will display information about the location and the percentage of the address space in that location (see Figure 7).

However, it can be difficult to view every part of the graph this way, even if other locations are hidden from view . Furthermore, results will still be aggregated if they cannot fit in the graph.
To see a complete list of locations, use the 'Show Details' (which becomes 'Hide Details' when expanded) link. This will display a table with the full results (see Figure 8).

Figure 8: Expanded 'Show details' with Geolocation History
Results can be sorted by any column, or limited by search (see Figure 9).

Now that the different ways to modify the display have been described, it is time to turn to an explanation of how to read the chart.
Timeline
By default, Gelocation History shows only a subset of the historic data which is available. The timeline at the bottom of the widget allows this range to be adjusted. Figure 10 shows an example of how the timeline could look when the widget loads.

Figure 11 shows the timeline after it has been adjusted. Both the left side and the right side of the range can be adjusted, to change not only the start and the end time, but also the amount of time included in the range.

After adjusting the range you will need to 'Load' the new results in order to see them. Note that there could be a significant delay if you select a large time range for a large resource.
Interpreting the Results
In most of the examples, the address space which is explained will be less than 100%. This does not mean that the addresses are not assigned, although this could be the case. It is an unfortunate limitation to geolocation data that information about location is not always available or accurate, for details please read the statement on the data source (GeoCity Light) .
When the results are limited to the top five results (as shown in Figure 12), the unused space in the graph can be a mix of locations which weren't among the top five, unknown locations, and unassigned space. When the view is expanded by removing the 'Top 5' limit (see Figure 13), the unused space consists only of unknown locations or unassigned address space. All locations which cannot be included in the display due to the limited size of the graph are aggregated as 'others'. Figure 13 shows an example where the address space is divided up between many locations, none of which accounts for a significant portion of the space. This is an example of where you would need to expand the table view for a full list of results.


The 'Top 5' is determined by identifying which location is used most frequently, over the entire time period. Thus one location which accounts for 25% of the space for four periods has the same weight as another location accounting for 100% of the space in one period.
A location which is used at any point during the total period will be listed in the detailed table . This is why particular locations may appear as 0% at specific times, for instance as Russia and Norway appear in Figure 14.

At the bottom of the widget is a timestamp indicating when the shown data is valid for.
Use Case: Credit Card Rejection
Credit card companies may flag transactions as suspicious if the person placing the order resides in a different country than the seller. A company selling goods may wish to prove to the credit card company that its interpretation of the company's location is inaccurate. Geolocation will show the present location of the resource (see Figure 15), but Geolocation History adds additional information by explaining why (in this example) a business in Russia was believed to be located in Norway (see Figure 16).

Figure 15: Geolocation shows the present location of a resource

With this information, the company has a convincing explanation for the inaccurate records.
Conclusion and feedback
RIPEstat is a modular and extendable toolbox designed as a single point of access to Internet-related data from RIPE NCC and other sources. Stat stands for 'status' and 'statistics'. RIPEstat is developed iteratively, and is a work in progress. Your feedback helps us identify development priorities, so take a moment to share your thoughts, either as a comment to this article, or using one of the following channels:
- The comment box on the RIPEstat website allows you to post comments publicly.
- The Measurement Analysis and Tools (MAT) working group mailing list allows for more in-depth discussions.
- Private feedback can be sent to stat@ripe.net .
- The #ripestat tag on Twitter is used by RIPE NCC to discuss and announce RIPEstat.
We hope that you find the new Geolocation History widget useful.

Comments 0
The comments section is closed for articles published more than a year ago. If you'd like to inform us of any issues, please contact us.