IPv6 RIPEness helped in creating awareness and got people into action with regards to their first steps towards deploying IPv6 in the RIPE NCC service region. Up until now IPv6 RIPEness didn't measure actual IPv6 deployment. In this article we propose a measure (a "5th star"), which attempts to measure actual IPv6 deployment at the edge.
Introduction
As described in earlier articles on RIPE Labs, IPv6 RIPEness tries to capture the IPv6-ness of Local Internet Registries (LIIRs) (and direct assignment users, but I'll leave that off for the sake of brevity in the rest of this article), based on 4 criteria:
- Having received IPv6 address space
- This IPv6 address space is seen in BGP (measured by RIS )
- This IPv6 address space has a route6 object in the RIPE Database
- This IPv6 address space has a reverse DNS object in the RIPE Database
While this captures steps in the deployment of IPv6, it doesn't capture actual IPv6 deployment at the edge. If we wanted to measure this, the following criteria should be applied:
- Indicative of actual IPv6 deployment
- Fair
- Difficult to cheat on
One thing to take into account is that there are many different types of networks and many different types of IPv6 deployment. There are 2 very broad categories of networks that we focused on:
- Access networks (eyeballs)
- Content networks
The way to measure IPv6 deployment in each of these types of networks is fundamentally different, so we'll measure them separately. If we are missing an important type of network, we could add that later on (suggestions welcome).
We started from the World IPv6 Launch target of 1% of IPv6-enabled hosts in networks, and wanted to find out if this is a useful threshold.
Access networks
How to measure IPv6 deployment in access networks? We cooperated with APNIC , and got an aggregate data feed from the Google Flash advertisements experiment . We receive monthly aggregates of number of IPv4-only and IPv6-capable clients seen in each block of IPv6 addresses that is mentioned in the RIR delegated files, which we can then map to LIRs.
In a monthly aggregate (August 2012) we see end-user measurements in address space allocated and assigned to 2,935 LIRs. Of these, 351 (12%) had activity in their IPv6 address space, and in 308 (10%) the activity was over 1% of the end-users that were sampled.
In half a year worth of aggregates (March 2012 - August 2012) we see measurements in address space allocated and assigned to 3,975 LIRs. Of these, 635 (16%) had activity in their IPv6 address space, and in 505 (13%) the activity was over 1% of the end-users that were sampled.
Both, a monthly and a half-yearly aggregate are useful for different purposes. With the half-yearly aggregate we not only capture the networks with bigger numbers of end-users, but also the relatively smaller networks. The half-yearly aggregate is disadvantageous if you are quickly deploying IPv6. In this case you'll have a lot of history where your network was IPv4-only, that will weigh against you, in the half-yearly aggregate, but not in the monthly aggregate.
We also have a bit of a small-sample-number problem when using this methodology. Smaller networks may only be sampled once, or a very small number of times, so this single, or small sample then determines the IPv6-ness of the network. As we want to measure both big and small networks, we think it's best to leave these measurements in regardless, and take the potentially large measurement error for granted. For a small access network to qualify, it would of course be best to enable IPv6 on all clients in the network, in which case whenever any client in the network is sampled, it will always be an IPv6-capable client.
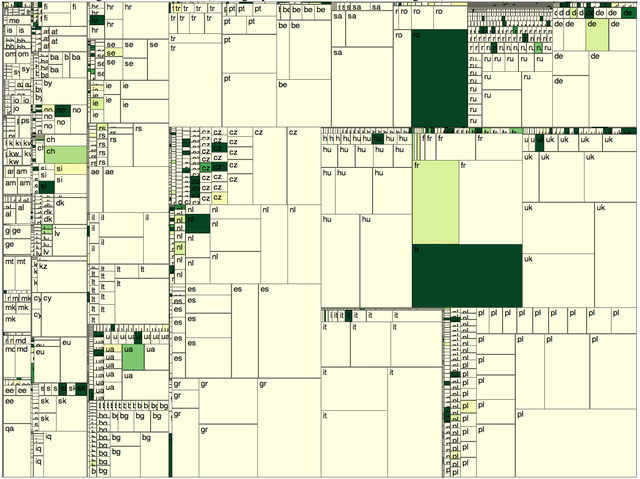
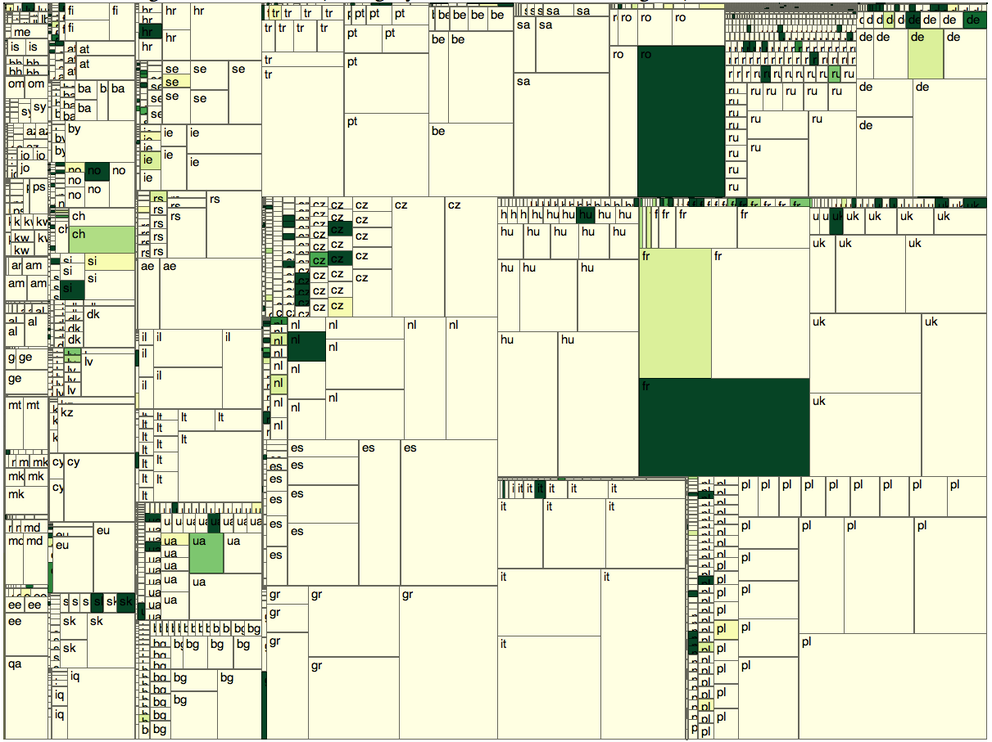
In Figure 1 we visualised the IPv6 deployment for the monthly aggregate of August 2012. Each square in Figure 1 represents an LIR. The colour of the square represents IPv6 deployment and goes in 9 steps from yellow (0% IPv6) to dark green (10% or more IPv6). The size of the squares represent how many measurements we got from that LIR's address space. Because the measurements are Google Ads, this is biased by the Google ad placement algorithm, that can easily prefer placing an ad in one network over another network. Even with this bias, it is expected that networks with more eyeballs will be sampled more often, so the size of a square in Figure 1 is correlated to the number of eyeballs in this network.
Content networks
For content networks, we looked at the Alexa 1 million list . We resolved all hostnames on this list to IP addresses, and mapped these to address space delegated to LIRs. The address resolution was performed from the RIPE NCC office network.
As the impact of enabling IPv6 on a highly ranked website should be much bigger then on websites that are ranked lower, we did weigh each entry in the Alexa list with the inverse of its rank ( i.e. 1/<rank>). This weight formula was chosen after fitting Alexa rank data with the client-reach data ('what percentage of total Internet clients does this website see?') that is also available on the Alexa website.
As an example of the weighting, consider an organisation that hosts two websites, ranked number 10 and number 1000. If the organisation would only dual stack the number 1000 website, 50% of their websites would be IPv6 enabled (1 out of 2), but if you weigh them by 1/<rank>, they'd only get a 0.99% score ( 100% * ( 1/1000 ) / (1/10 + 1/1000) ). On the other hand, if they'd dual stack the number 10 website, they'd get a 99% weighted score ( 100% * ( 1/10 ) / ( 1/10 + 1/1000) ).
On an example day (6 September 2012) we see 4,702 LIRs with address space that hosts content from the Alexa 1M list. Of these, 493 (10%) have at least one website that is IPv6 enabled, as measured by having a AAAA record for the hostname. For now, we didn't actually check if we could make a HTTP connection to the IPv6 addresses listed. Of the LIRs we see 404 (9%) has over 1% of their Alexa 1M domains IPv6 enabled. If we weigh these as described above, we have 372 (8%) LIRs that would qualify for a 5th star based on >1% of their weighted content accessible over IPv6.
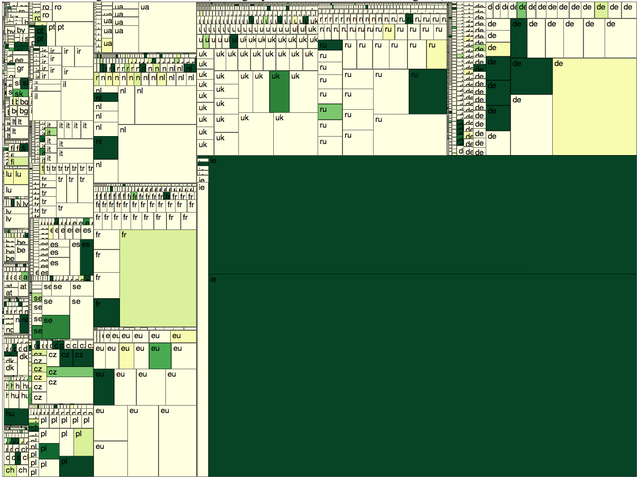
Figure 2 is a visualisation of these results. Each square in Figure 2 represents an LIR. The area of each square is proportional to the number of websites in the Alexa 1M that is hosted in this LIRs address space, weighted by rank (1/<rank> as described above). The colour of the square represents IPv6 deployment and goes in 9 steps from yellow (0% IPv6) to dark green (10% or more IPv6). Even when not considering the very big squares in the bottom-right corner (Google and Facebook), it appears that more organisations of larger relative sizes have IPv6 in production on the content side than on the access side (Figure 1).
Rough Edges
One unresolved issued with all methodology described above is that we map both IPv4 and IPv6 address space to a single LIR. This is typically not a problem, but very large organisations may have multiple LIRs, and/or have address space from multiple RIRs. For instance in the case of Google when resolving www.google.com from the RIPE NCC network, the result show IPv4 addresses allocated by ARIN, whereas the IPv6 addresses has been allocated by RIPE NCC.
Compared to 4star RIPEness
In summary we currently see 736 LIRs that fall into either the content or access 5th star category, which is roughly 12% of the LIRs we saw in either of the measurements and roughly 9% of the total number of LIRs.
An interesting question is: How many of the 1,563 4star LIRs in the current system, qualify for a 5th star? If we apply the method described above, we see:
- 815 LIRs didn't meet the criteria for the 5th star
- 624 LIRs do (roughly 7% of total number of LIRs)
- 124 LIRs where not seen in our measurements
And of those 736 LIRs that qualify for a 5th star, what level of IPv6 RIPEness do they currently have:
- 1 LIR has 1 star
- 13 LIRs have 2 stars
- 98 LIRs have 3 stars
- 624 LIRs have 4 stars
Conclusions
Our preliminary work, described above, suggests a way to measure LIRs as content and/or access network. If the measured IPv6 level is above a certain threshold (currently 1%), the LIR automatically gets awarded an IPv6 RIPEness star. Together with the other 4 stars, that would get the LIR to "5 star IPv6 RIPEness".
We are curious as to what people think of this definition for the 5th IPv6 RIPEness star, one that should measure actual IPv6 deployment at the edge.
If you have any questions/suggestions/concerns please post them below!



Comments 0
The comments section is closed for articles published more than a year ago. If you'd like to inform us of any issues, please contact us.