
This article is looking at different measurements done at the network level and at the end user level and the results seen through these measurements.
Recent IPv6 statistics from the RIPE NCC show an accelerated uptake of IPv6 in Norway, both in terms of the number of allocated prefixes, and visible announcements in the routing system. This is based on a comparison over time of the amount of IPv6 addresses allocated to each economy, and the amount of visible prefixes per Autonomous System (AS) in the routing tables each day.

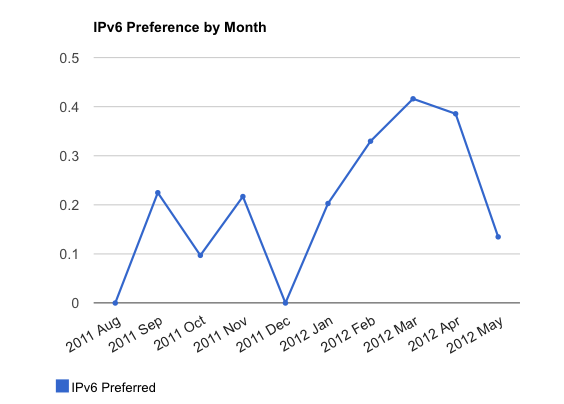
Some have incorrectly interpreted this to mean that over 50% of the end users in Norway have now access to IPv6. End user IPv6 capability measurements being undertaken by APNIC suggests end user access to IPv6 remains low in Norway, as in other economies. The graph below shows the percentage of IPv6 preference at the end user level.

Note that this only includes data until mid May 2012. For the most up to date graph. If you click on the image, you will get to the most up to date graph and the underlying methodology.
Are these measures in conflict?
No, not really. One is a measure of capacity and capability in routing and forwarding, and the other is a measure of end user access. There are many reasons why some routing active entities don't show up in an end user measure: the AS may be servicing content delivery and not offering access services, or may be providing transit and data management services for others, and have no direct end user traffic.
Perhaps the AS is servicing segments of the user base who only gain access to the global Internet occasionally, or to restricted URLs, or not even the web but only VOIP (which we can't measure in the APNIC technique.)
The difference is not a conflict, but is exposing differences in what we see on the Internet, and different conclusions have to be drawn from each.
APNIC's measurement focuses on end user access, and in large part, suggests that there is a continuing problem with end user access to IPv6, even when the AS in question may have associated IPv6 allocations visible in global routing.
The fundamentals of this problem are still unclear but probably relate to the need to upgrade customer premises equipment (CPE) to permit deployment of native IPv6 to customers. This has been extensively covered in other articles such as the 2011 RIPE Labs article on the
IPv6 CPE Survey
by Marco Hogewoning and Mirjam Kühne.
Announcing IPv6
In order to make an IPv6 prefix visible in the global routing system, a network engineer has to add several lines of text to their BGP definitions in a router configuration, and in order to prevent filtering by neighbors and up-streams, also prepare a brief statement of their routing intentions to publicly list in an
Internet Routing Registry
(IRR). (this doesn't directly alter how BGP works, but it does help prevent other ISPs from filtering out the announcements seen). The total work is not great, and the impact on the core routing stability of the ISP is not great, so this is both easy to do, and a low-risk activity.
Therefore it is not surprising that many IPv6 address holders have in fact made an announcement, and if you look at the BGP routing tables, you will see a total of around 8000 prefixes, where the allocation records show a total of 10000. On this measure, 80% of prefixes allocated by count are visible. Of course, traffic engineering and the need to announce multiple sub-splits of an allocation alter this, but to a first approximation we can say that 80% visibility suggests people who get given IPv6 make it available. This is good!
What else is needed on the provider's side?
However, making a BGP announcement visible is by far the easiest part of deploying IPv6 in a network. The resource has to be sub-structured, and assigned to subnets inside the internal routing system. each internal router has to be configured with its own subspace, and likewise local support systems such as DNS, DHCPv6 and ACLs configured to make the subspace work in the local context: assign end-site addresses, map names to addresses, propagate internal routing.
This is not logistically different to IPv4, except that there are far fewer tools to manage this, and therefore far higher labour costs, and associated risk (in fact, where systems exist to manage network configuration in IPv4, hand adding IPv6 is very probably next to impossible because the automatic systems will be overwriting configurations with IPv6 updates, replacing them with IPv4 only material).
What else is needed on the customer's side?
Then, there is the problem of getting the customer to actually request and configure IPv6 on their hosts. Now, by default, Vista, Windows 7, and OSX (along with Android and iOS) will in fact request IPv6 configuration on boot. They will do this continuously once booted in the background, and are more than capable of working in an IPv6 environment out-of-the-box. Windows XP and other operating systems vary in their configuration, mostly being able to run IPv6 but rarely automatically configured to enable it (Linux and FreeBSD
systems will detect and enable IPv6 but are not always configured to do this from installation).
The missing link is the CPE: the customer premises router, which attaches to the ISP and crucially mediates the link technology (cable, ADSL, modem, 3G) to provide the service to the users host. These devices typically run small embedded operating systems (often linux) with reduced memory footprint and have few (if any) opportunities for field-upgrade of the code.
Although CPE have been known to need to be IPv6 capable for some time, the actual deployment rates of IPv6 capable units has been low: DocSys 3 modems, and some more recent ADSL2+ devices (fritz, netcomm, billion, dynalink and D-link to name a few) are known to work in current deployments, but the overwhelming majority of CPE devices deployed today cannot and will not do IPv6.
Measurement Methodology
APNIC's measurement methodology is examining end user IPv6 capability by use of fetches of 'invisible' one-pixel images, backed by different network addresses: one on dual-stack, one on IPv4 only, one on IPv6 only, one on an IPv6 literal address (which forces open automatic tunneling). Two different methods of fetching these test images
are being used: a javascript mechanism which asks website owners to include mark up on their web page similar to google analytics, (and which in fact can report into google analytics for the website owner to understand their user/client capabilities) and a flash
based mechanism which requires no changes to a web, and relies on paid flash advertising to be displayed worldwide.
These mechanisms are generating around 1m measurements per day worldwide, and have generated a wealth of data for regions, economies and ISPs.
The Situation in Norway
Analysis of the data for Norway suggests that the higher level of IPv6 deployment by network holders has not yet been matched by an increased uptake in IPv6 by end users. There has been a surge of indirect use of IPv6, because the 'Opera' Browser has now included a speed-cache mechanism aimed at smart phone users on Android and iPhone, and this includes a worldwide proxy deployment which is fully IPv6 enabled: so by indirect fetches, Norway shows a high number of users. But if you ask for direct access figures, the story is more common with the rest of Europe.
At this time, Norway shows an IPv6 capability (including use of tunneling) of the order 3.36%. If IPv6 preference (a stronger indication of access to native IPv6, or ISP installed mechanisms like 6rd) is measured, the figure is 0.14%. These figures are essentially unchanged over the last 6 months, from a monthly sample size of over 1500 measurements (there is variance on a monthly basis, and the figure has been as high as 0.3% but its certainly not uniformly rising, nor into the high single digits yet).
The story is no better when examined by ASNs. Although a significant proportion of Norwegian ISPs demonstrate IPv6 routes in the global BGP, far fewer appear to be deployed in a way which customers can exploit. At this time, only 3 AS are consistently visible from Norway with end user traffic:
| ASN | Company Name |
| AS2119 | TELENOR-NEXTEL |
| AS15659 | NEXTGENTEL |
| AS29695 | LYSE-AS |
More are in fact counted, but because the overwhelming use is via Opera-proxy, they have been discounted in the APNIC measurement.
APNIC has successfully measured access by 112 of the 175 ASNs in Norway but unfortunately most of these ASNs have generated insufficient data to be an accurate measure. If you only have 2 samples, and one did IPv6, to declare that you have 50% IPv6 preference would be a mistake. On the other hand, the IP ranges being seen unquestionably have IPv6 enabled to the end user. This is interesting because it suggests at a basic level, the APNIC 1x1 measure can determine that 64% of the ASNs in Norway are 'end user servicing' ASes, and that whilst only a few prefixes inside each ASNs have been seen, we have a sense that 64% of the discrete routing entities service end users. It is possible that this measure is an effective tool for distinguishing end user from exchange/transit, content serving and other AS usage. This is a fruitful area for future study.
If we accept a significant drop in statistical validity and consider the top 50 Norwegian ASNs which have been seen in the experiment, and focus on the last 3 weeks of data, we see in fact there is some evidence of wider IPv6 availability to end users. The following 16 ASNs for instance, record significantly higher IPv6 preference values in this more loose measure:
| ASN | Company Name |
| AS2119 | TELENOR-NEXTEL Telenor Norge |
| AS8542 | BKKB BKK Fiber |
| AS13069 | DATAGUARD DataGuard |
| AS15659 | NEXTGENTEL NEXTGENTEL |
| AS15765 | MIMER Tafjord Mimer AS |
| AS25148 | BASEFARM-ASN Basefarm |
| AS29695 | LYSE-AS Altibox |
| AS31283 | FASTHOST |
| AS35094 | Pronea |
| AS39029 | REDPILL-LINPRO |
| AS39832 | Opera Software |
| AS41164 | GET Norway |
| AS41572 | Hafslund Telekom Nettjenester |
| AS49455 | Loqal |
| AS50608 | Ventelo Hosting |
| AS51135 | Tel-Ag |
There is therefore reason to hope that the IPv6 penetration in Norway is real, and is reaching the edge. It would be a mistake to believe the story is over: there is a long way to go in achieving a realistic worldwide deployment, but the signs are encouraging.
The Situation in Japan
As a comparison, Japan has been seen in the APNIC measurement in 43 ASNs, out of a total of 126 assigned to Japanese entities. The difference is quite marked: Japan has a far larger population (127 million) than Norway (5 million) and yet has broadly the same number of ASNs assigned to the economy. Clearly there is far more independently routed networks per capita in Norway than Japan, yet of the 43 seen ASNs in Japan 29 are providing statistically useful volumes of data.

Figure 3: IPv6 preference in Japan by month
Alas, only the following 9 ASNs show any significant IPv6 deployment by the same loose count:
| ASN | Organisation Name |
| AS4713 | OCN NTT Communications Corp. |
| AS2510 | INFOWEB Fujitsu Ltd. |
| AS2518 | BIGLOBE, Ltd. |
| AS2519 | VECTANT Ltd. |
| AS17676 | GIGAINFRA Softbank BB Corp. |
| AS10010 | TOKAI Victokai Corp. |
| AS17506 | UCOM Corp. |
| AS2497 | IIJ Internet Initiative Japan Inc. |
| AS2516 | KDDI Corp. |
So, by this measure, Norway has both more active ASNs, more ASNs visibly deploying IPv6, and more ASNs offering IPv6 to end users.
However, Norway and Japan are radically different economies, in terms of scale and Gross Domestic Product (GDP).
APNIC compiles a regularly updated table of the relative address distribution by economy including basic GDP and population data from external sources, for both IPv4 and IPv6:
http://bgp.potaroo.net/iso3166/v4cc.html
http://bgp.potaroo.net/iso3166/v6cc.html
From this, we can see Norway ranks 29th in the world by % holdings in IPv4. By comparison, in IPv6 it stands at the 19th position. In relative terms, performing better. Once population, GDP, and AS visibility is factored in, the relative rankings change radically. By announced IPv4 space, Norway ranks in 60th place, whereas by IPv6 it still ranks 19th. Therefore, considering the relative size, population and economic worth, Norway is substantially ahead of the field in relative terms, in IPv6: more of the effective economic
value is available.
It's therefore sad that end user access remains at a low level. However, in context, it remains amongst the top 25 end user access enabled economies which rank as follows, with Norway in 23rd place.
| Country | % of IPv6 at customer |
| France | 3.022 |
| Romania | 2.722 |
| Japan | 1.583 |
| European Union | 1.575 |
| Luxembourg | 1.536 |
| Slovakia | 0.637 |
| United States | 0.593 |
| China | 0.585 |
| Slovenia | 0.432 |
| Taiwan | 0.368 |
| Russia | 0.241 |
| Brunei | 0.315 |
| The Netherlands | 0.271 |
| Kenya | 0.256 |
| Czech Republic | 0.243 |
| Portugal | 0.234 |
| Belarus | 0.222 |
| Ukraine | 0.214 |
| Macao | 0.208 |
| Hong Kong | 0.189 |
| Germany | 0.170 |
| Bangladesh | 0.157 |
| Norway | 0.149 |
| Malaysia | 0.136 |
| Georgia | 0.126 |
Note: The reason the European Union is included in the list, is that for some resources, the correct country cannot be determined. In these cases, EU is chosen as a catch-all.
On APNIC Labs you can find a
map showing the percentage of IPv6 end user access
by for each economy. You can also find more information about the methodology and other IPv6 measurements.

Figure 4: Map showing end user IPv6 access per economy
It is also notable that overall economic size or GDP is not necessarily a good indication of the likelihood of high IPv6 penetration. Smaller economies with fewer visible players, or only a few large cities are perhaps at an advantage in that a deployment involves less complexity, and achieves higher % penetration into the cable and network plan, per capita compared to physically large, populous economies or ones with a highly distributed economic base.
Future work could usefully explore the relationship between the amount of Internet resources deployed in economies and regions, the amount seen, and the relativities between these distributions. It would help explain systematic biases in the measurements, and also inform questions of the GDP and economic relativities of the costs and benefits of the IPv6 network deployment.


Comments 6
The comments section is closed for articles published more than a year ago. If you'd like to inform us of any issues, please contact us.
Ragnar Anfinsen •
Great article. Now we just need to follow up with more eyeballs and traffic... :) Altibox will deliver IPv6 to all new customers stating this summer/autumn, so lets look back at the numbers early next year to see if it has any impact.
Tore Anderson •
I am very surprised that AS5381 PowerTech does not figure in either of the lists of IPv6-capable organisations in Norway. They are one of very few ISPs here that have more or less completed their IPv6 deployment, with dual-stack being provided to all their subscribers (of course, not all of their customers will be able to use it due to having IPv4-only HGW). While they are not the largest ISP, they have significantly more end users than several of the other networks mentioned in the second list. I've noticed that http://bgp.he.net/ for some reason incorrectly places AS5381 in the European Union instead of in Norway, could this be happening here too? Tore
Tore Anderson •
Oh, and let's not forget AS224 UNINETT (the Norwegian University and Research Network), has for many years had the highest concentration of IPv6-enabled end users by a very large margin. In my own measurement data, currently about 40% of all IPv6 traffic comes from them (2001:700::/32). That they're not even included at all makes me very suspect of the quality of the underlying data here... Tore
Mirjam Kühne •
Passed on from George: The reason why AS's AS5381 and AS224 were not included is because (as Tore has pointed out in private email) they currently tag as EU in the ripe delegated stats files. Both do in fact show significant IPv6 traffic and I believe would have appeared in the listings for this article as significant IPv6 enabled networks.
Geoff Huston •
AS5381 is marked as NO - the reason why is does not figure in these lists is because we use a low water threshold of a minimum number of measurements to contribute to the per-AS measurement numbers. IN the case of AS5381 we simply have not conducted enough client measurements to pass the threshold. AS224 is different - this is a very old AS assignment and the stats files we use to country-locate the AS marks this AS as "EU" rather than country code "NO". As with many attempts to geo-locate resources we are only as good as our input data, and in this particular case the country assignment for AS224 is not entirely helpful! Geoff
Roger Jørgensen •
I find it strange that Ventelo ain't listed as one of the 15 ASN, but could be because of low usercount of course. My household have been doing v6 traffic toward whoever have it (including google) for close to 2years now using Ventelo's prefix. Also as other have mention, Uninett and Powertech is not listed but they are explained.