
Time for another annual roundup from the world of IP addresses. Let’s see what has changed in the past 12 months in addressing the Internet, and look at how IP address allocation information can inform us of the changing nature of the network itself.
The process of exhausting the remaining pools of IPv4 addresses in each of the Regional Internet Registries (RIRs) is continuing. Yet, despite this hiatus in the supply of IPv4 addresses, the Internet continues to grow. The reasons for this growth are changing, however.
Personal computers have gone the way of mainframes and are no longer the staple of the consumer IT market. It looks as if laptops are now also feeling the pinch as the mainstream computer industry continues to focus on the smart device market. But even in the personal device sector, we see a market that is no longer expanding at massive rates.
In January 2017, Gartner released its estimate of the worldwide device sales for 2016-2019. Traditional PC shipments are estimated to total some 205 million units for 2017, representing an 6% decline from 2016. “Peak” personal computers have now come and gone, and these personal devices are following their mainframe predecessors off to silicon heaven!
Smartphone sales are more than four times greater than PCs in terms of volume, selling an estimated 1.8 billion units for the year, but there is evidence that this market is saturating and projections for sales volumes in the coming years show no signs of further growth.
The total volume of deployed phones, tablets and PCs sits at some 7 billion devices and further sales appear to be dominated by replacement units rather than expansion into greenfield markets. We appear to be getting very close to a current ceiling for these human-driven devices.
However, the silicon industry is far too rapacious to be stalled by such a mundane consideration as market saturation.
Today, we are seeing computers disappear as recognisable computers and reappear cloaked in some other functional wrapper. While the smart watch has not proved to be a game-changer, there is a myriad of other clever gadgets. We’re seeing the consumer offerings with Internet-based home lighting systems and other forms of household automation that involve sensors and appliance management, such as energy management, irrigation management and similar. Today’s opportunity encompasses all these embedded devices that collectively have been labelled “The Internet of Things”.
However, the exuberant optimism of 12 months ago when predictions of between 50 and 100 billion connected devices by 2020 has been tempered. Gartner now projects that this world of chattering silicon will get to 20 billion devices by 2020. But there is much uncertainty in these numbers. Other indicators point to a highly capable silicon production line where more than 20 billion microprocessors and 10 billion RFID tags were made in 2016 alone. But it’s challenging to place these numbers into a solid analytical predictive framework, so there is a considerable uncertainty with these numbers when we try to look forward over the next three to five years.
What does all this mean for the Internet?
Obviously, the device population of the Internet continues to grow but it appears that most of the growth of the network is occurring behind various forms of IPv4 Network Address Translators (NATs). These devices are then largely invisible to the public network, so efforts to track their population are challenging.
The deployment of these devices behind NATs places very little in the way of pressures on address consumption. While the Internet may have absorbed in 2016 a production quantity of some 270 million personal computers, 1.8 billion smart phones and a further 1.8 billion connected devices, that does not mean that there has been a demand for some 4 billion additional IP addresses.
Part of this volume has replaced older equipment, and almost all these additional devices find themselves positioned behind NATs, making only minor demands on the overall address structure. The total drain on the remaining unallocated IPv4 address pool was just 22 million addresses for 2016.
This was the issue that IPv6 was primarily intended to solve. The copious volumes of address space were intended to allow us to uniquely assign a public IPv6 address to every such device, no matter how small, or in what volume they might be deployed. Why this has not happened so far, and why we are still concentrating a significant proportion of our efforts on stretching IPv4 to encompass an ever-larger population of attached devices are critical questions.
Answers to these questions are not simple. There is the:
- Lack of backwards compatibility for IPv6, in that an IPv6 device can only communicate with other IPv6 devices, which excludes the IPv4 world.
- Networked effect where the maximal value for a connection is attained when it can reach all connected services.
- Issue of sunk cost for network operators, where the cost of the deployment of the new protocol does not generate any economies in the costs of network operation.
- Observation that human use devices represent higher value and therefore greater market power than low cost and intrinsically low-value devices even if their volumes are highly disparate.
The result is a protracted gradual transition in the Internet, where network operators and service providers are adding IPv6 to their services in a piecemeal, and some more inpatient folk might say even lackadaisical, basis.
Today’s Internet is close to 100% IPv4 and around 10% IPv6. Or, in other words, around 10% of the Internet’s end user population use devices that have both protocol stacks provisioned within the device, and have coupled that with a dual stack network service. All the remainder is IPv4.
Given this level of relative deployment, it is not surprising that we have still not seen any major service provider or services move one-step further on from a dual stack environment and discard IPv4 support completely. It remains the case that the forays into the dual stack world continue to enlarge the pool of IPv6 capable users and devices, but at this stage, this IPv6-capable user population still does not represent a viable market in isolation from the IPv4 Internet.
Service providers across the Internet are still required to support IPv4 using whatever approaches they have available, so it should be unsurprising to observe the almost universal use of IPv4 NATs as a means of stretching the limited pool of available public IPv4 addresses across ever larger pools of connected devices.
But it’s not that hopeless. We don’t have to wait for near universal adoption of dual stack services before we can reduce the pressure on IPv4 and NATs.
Most popular browsers, and many other dual-stack aware applications, are willing to test if a network transaction is viable using IPv6 before opening an IPv4 session, and as the extent of IPv6 availability increases we can expect to see increasing numbers of transactions over IPv6, which may relieve some of the pressures on the NAT space.
IPv4 in 2016
The process of exhausting the remaining pools of unallocated IPv4 addresses is proving to be as protracted as the process of the transition to IPv6.
The allocation of 22 million addresses in 2016, on top of a base of 3,558 million addresses that are already allocated at the start of the year, represents a growth rate of 1.1% for the year for the allocated public address pool. This is less that one tenth of the growth in 2010 (the last full year before the onset of IPv4 address exhaustion).
| 2007 | 2008 | 2009 | 2010 | 2011 | 2012 | 2013 | 2014 | 2015 | 2016 | |
|---|---|---|---|---|---|---|---|---|---|---|
| Allocated Addresses (M) | 203.9 | 203.3 | 189.4 | 248.8 | 201.0 | 114.9 | 65.1 | 63.9 | 34.8 | 22.2 |
| Total Annual Volume (B) | 2.32 | 2.52 | 2.72 | 2.90 | 3.14 | 3.34 | 3.43 | 3.50 | 3.59 | 3.62 |
| Relative Growth | 8.4% | 7.9% | 6.6% | 8.3% | 6.4% | 2.9% | 1.9% | 1.8% | 1.0% | 0.6% |
Table 1 – IPv4 Allocated addresses by year
The record of address allocations per RIR over the past 10 years is shown in Table 2.
| 2007 | 2008 | 2009 | 2010 | 2011 | 2012 | 2013 | 2014 | 2015 | 2016 | |
|---|---|---|---|---|---|---|---|---|---|---|
| APNIC | 69.6 | 87.8 | 86.9 | 120.2 | 105.2 | 1.0 | 1.3 | 3.7 | 4.1 | 3.8 |
| RIPE NCC | 60.7 | 44.0 | 43.4 | 56.0 | 43.1 | 40.0 | 2.0 | 2.5 | 3.3 | 3.4 |
| ARIN | 53.0 | 57.1 | 41.1 | 45.2 | 23.5 | 45.0 | 26.5 | 26.0 | 8.6 | 1.6 |
| LACNIC | 14.2 | 12.0 | 10.5 | 13.0 | 24.4 | 21.0 | 28.5 | 19.1 | 1.8 | 1.6 |
| AFRINIC | 5.5 | 1.6 | 5.9 | 8.5 | 9.2 | 7.9 | 6.8 | 12.5 | 16.9 | 11.8 |
Table 2 – IPv4 Allocated addresses (millions) distributed by RIRs
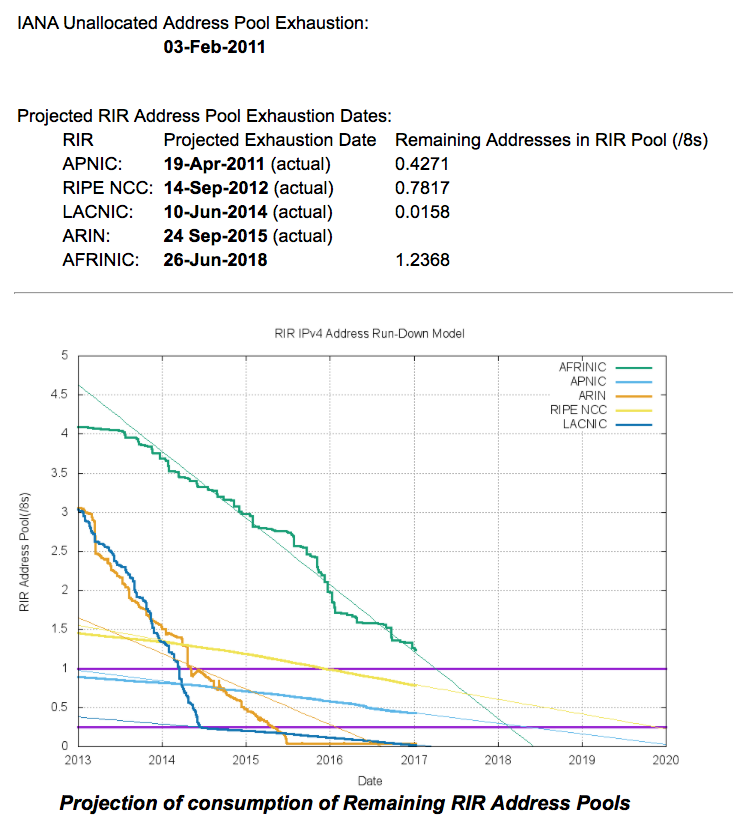
In terms of the IPv4 Internet, there is a considerable diversity in the situation in each region. As of the end of 2016, AFRINIC was the last remaining RIR with remaining IPv4 addresses available for general allocation, with slightly over 20 million addresses left in its address pool. APNIC and the RIPE NCC have both adopted “Last /8” policies, where each applicant can receive just a single allocation of up to 1,024 addresses from their respective last /8 address pools. ARIN and LACNIC both have much smaller residual IPv4 address pools, and to all intents and purposes, they have both run out of addresses.
The current position of each RIR, and the projections of IPv4 address consumption in the coming years is shown in Figure 1.

Figure 1 – IPv4 Exhaustion
APNIC
In 2016, APNIC allocated 3.8 million IPv4 addresses. APNIC effectively exhausted its general use pool of addresses in April 2011, and since then the registry has been operating under the terms of a “Last /8” policy that limits each entity to at most 1,024 addresses drawn from this residual address pool.
APNIC recorded some 4,325 individual address allocations in 2013. Of these, 3,019 entries refer to allocations from APNIC’s last /8 address block (103.0.0.0/8) and represent a total of 2.53 million allocated addresses. The average size of allocations from this block is 840 addresses, or between a /23 and a /22.
There were 7.1 million addresses remaining in this particular address pool at the end of 2016, and assuming an ongoing consumption rate of some 2.5 million addresses per year, the pool will last until late 2019. The remaining 1,306 allocations were drawn from those addresses assigned to APNIC from the recovered IPv4 address pool.
The average allocation size from this pool was 956 addresses. By the end of 2016, this second address pool was effectively exhausted, so all that remains for APNIC is the 7.1 million addresses in the last /8 pool.
However, a further 4.1 million addresses are marked as ‘reserved’ by APNIC. There are a variety of reasons for this marking, including non-contactability of the original address holder, or addresses undergoing a period of ‘quarantine’ following a forced recovery. Evidently, efforts are being made to reduce the size of this pool, as in August 2015 the size of the reserved pool was 4.6 million addresses.
RIPE NCC
RIPE NCC exhausted its general use pool of addresses in mid-September 2012. This RIR allocated some 3.4 million addresses in 2016, and recorded 3,306 allocations, using their “last /8” address allocation policy, which is similar to that used by APNIC. The average allocation size was 1,024 addresses per allocation, which is comparable to the 2015 figures for this registry.
At this allocation rate, the remaining pool of IP addresses, some 13.15 million addresses at the end of 2016, will last for a further 4 years, or until late 2020. At the end of 2016 the RIPE NCC has some 1.05 million addresses marked as ‘reserved, up from 850,000 addresses a year earlier.
LACNIC
LACNIC exhausted its general use pool of IPv4 addresses in June 2014, leaving some 4 million addresses in its residual address pool. This registry allocated some 1.6 million addresses in 2016, and there are 314,000 addresses left as “available”.
LACNIC are holding some 5 million as “reserved” at the end for 2016, up from 4.7 million at the start of the year.
ARIN
ARIN exhausted its general use IPv4 pool in September 2015. The registry is holding some 6.3 million addresses as “reserved”, which represents no change to the number of reserved addresses held by ARIN 12 months ago.
AFRINIC
AFRINIC address consumption rate increased in 2015 from its 2014 level, and the 16.9 million addresses allocated in 2015 is the highest address consumption level for AFRINIC to date. At this stage, it appears that AFRINIC’s remaining 32.7 million addresses as of the start of 2017 will last a further two years, until the end of 2018. AFRINIC are holding 770,304 addresses in a “reserved” pool.
IANA
Finally, the IANA is holding 80,128 addresses in its recovered address pool in 101 discrete address blocks. This pool is large enough to assign each RIR a /19 in March 2017, but not quite large enough to support a /18 round of allocations. This relatively small allocation to each RIR will have little in the way of impact on the overall IPv4 picture.
The RIR IPv4 address allocation volumes by year are shown in Figure 2.
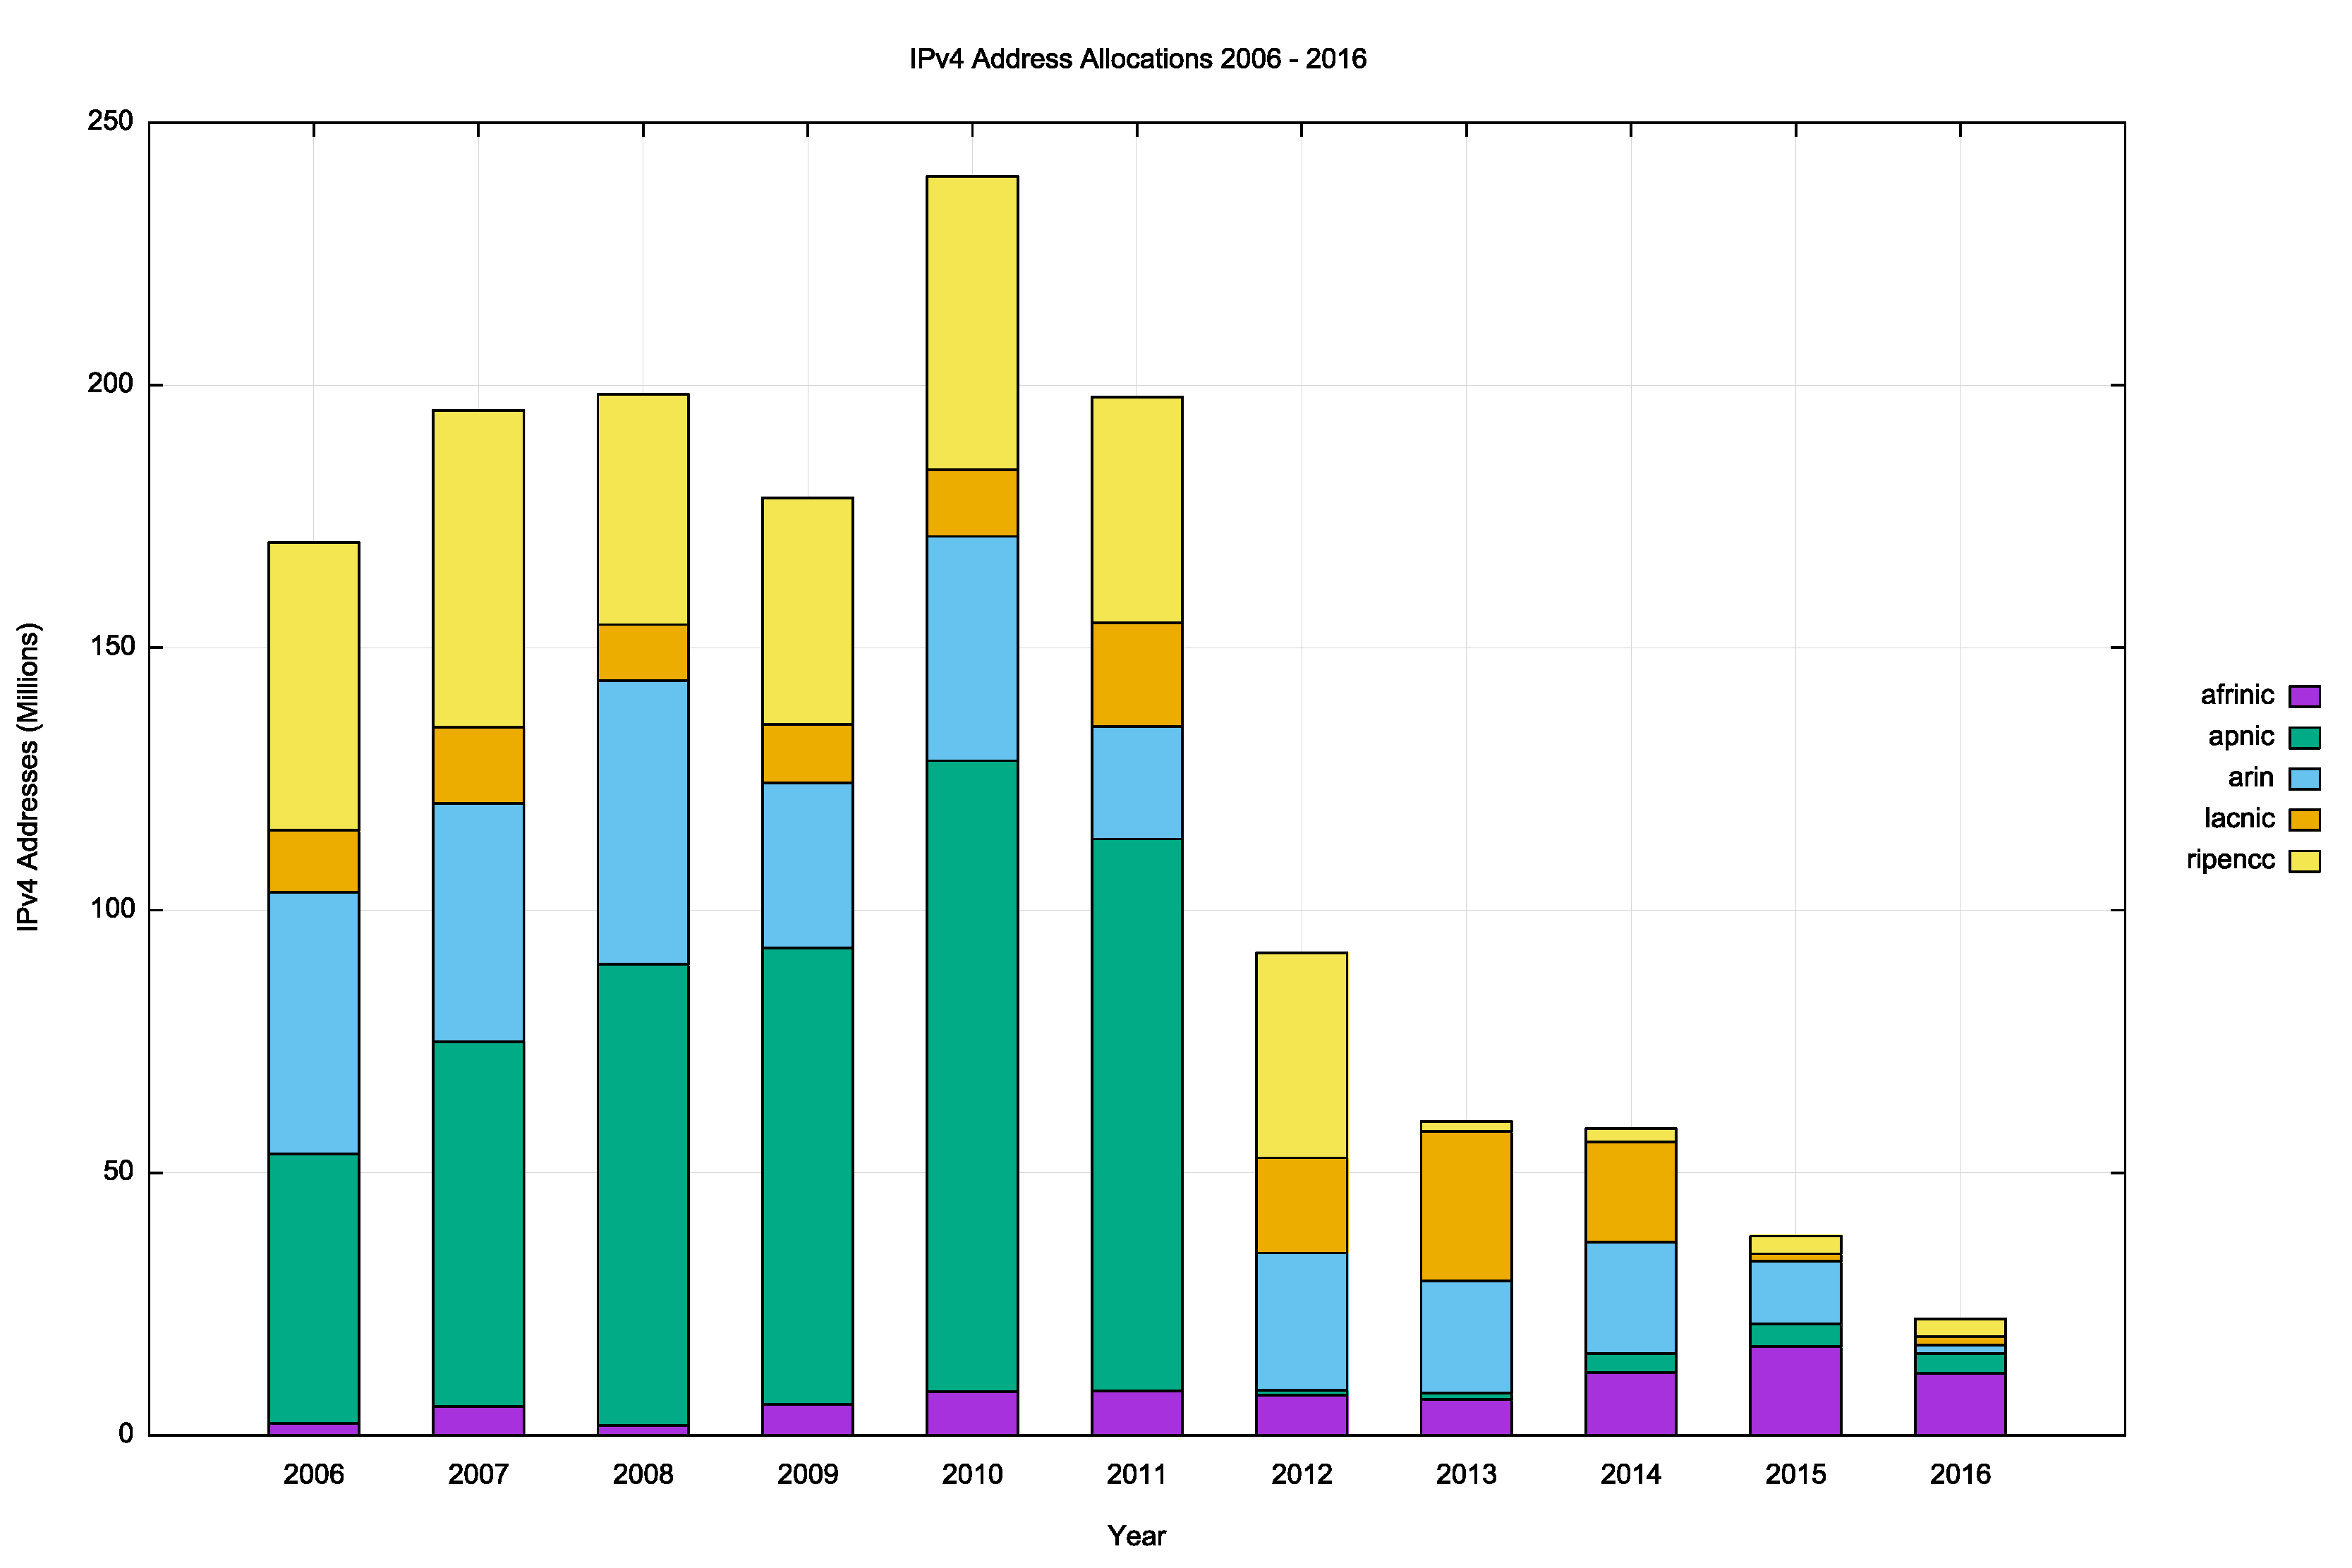
Figure 2 – IPv4 Allocations by RIRs 2006-2016
Which countries received the largest pool of IPv4 address allocations in 2016?
| Rank | 2012 | 2013 | 2014 | 2015 | 2016 | |||||
|---|---|---|---|---|---|---|---|---|---|---|
| 1 | USA | 28.2 | USA | 25.0 | USA | 24.5 | USA | 7.6 | Morocco | 3.1 |
| 2 | Canada | 16.7 | Brazil | 17.4 | Brazil | 10.9 | Egypt | 7.4 | Seychelles | 2.1 |
| 3 | Brazil | 8.4 | Colombia | 3.8 | Morocco | 2.6 | Seychelles | 2.1 | USA | 1.7 |
| 4 | Russia | 5.3 | Argentina | 1.6 | Colombia | 2.1 | Sth Africa | 2.0 | China | 1.3 |
| 5 | Iran | 4.5 | Egypt | 1.6 | Sth Africa | 1.7 | Tunisia | 1.8 | Brazil | 1.3 |
| 6 | Germany | 3.4 | Canada | 1.4 | Egypt | 1.6 | Brazil | 1.4 | Sth Africa | 1.2 |
| 7 | Sth Africa | 3.4 | Nigeria | 1.2 | China | 1.5 | China | 1.3 | India | 1.1 |
| 8 | Italy | 3.3 | Chile | 1.1 | Canada | 1.5 | India | 1.3 | Egypt | 1.1 |
| 9 | Colombia | 2.6 | Mexico | 1.1 | Kenya | 1.4 | Canada | 1.1 | Kenya | 1.1 |
| 10 | Romania | 2.6 | Seychelles | 1.0 | Mexico | 1.1 | Ghana | 0.6 | Algeria | 1.1 |
Table 3 – IPv4 Allocated addresses, top 10 economies (millions of IPv4 addresses allocated in the year)
This distribution is not surprising, and the countries in this year’s top 10 list in Table 3 largely correspond to the RIRs with remaining IPv4 addresses.
IPv4 Address Transfers
In recent years, several RIRs (RIPE NCC, ARIN and APNIC) have included the registration of IPv4 transfers between address holders, as a means of allowing secondary re-distribution of addresses as an alternative to returning unused addresses to the registry.
This has been in response to the issues raised by IPv4 address exhaustion, where the underlying motivation is to encourage the reuse of otherwise idle or inefficiently used address blocks through the incentives provided by a market for addresses, and to ensure that such address movement is publically recorded in the registry system.
The numbers of registered transfers in the past four years is shown in Table 4.
| Receiving RIR | 2012 | 2013 | 2014 | 2015 | 2016 |
|---|---|---|---|---|---|
| ARIN | 79 | 31 | 58 | 277 | 727 |
| APNIC | 255 | 206 | 437 | 514 | 581 |
| RIPE NCC | 10 | 171 | 1,050 | 2,852 | 2,411 |
| Total | 344 | 408 | 1,545 | 3,643 | 3,719 |
Table 4 – IPv4 Address Transfers per year
A slightly different view is that of the volume of addresses transferred per year (Table 5).
| Receiving RIR | 2012 | 2013 | 2014 | 2015 | 2016 |
|---|---|---|---|---|---|
| ARIN | 6,728,448 | 5,136,640 | 4,737,280 | 37,637,888 | 15,613,952 |
| APNIC | 3,434,496 | 2,504,960 | 4,953,088 | 9,836,288 | 7,842,816 |
| RIPE NCC | 65,536 | 1,977,344 | 9,635,328 | 10,835,712 | 9,220,864 |
| Total | 10,228,480 | 9,618,944 | 19,325,696 | 58,309,888 | 32,677,632 |
Table 5 – Volume of IPv4 addresses transferred per year
A plot of these numbers is shown in Figures 3 and 4.
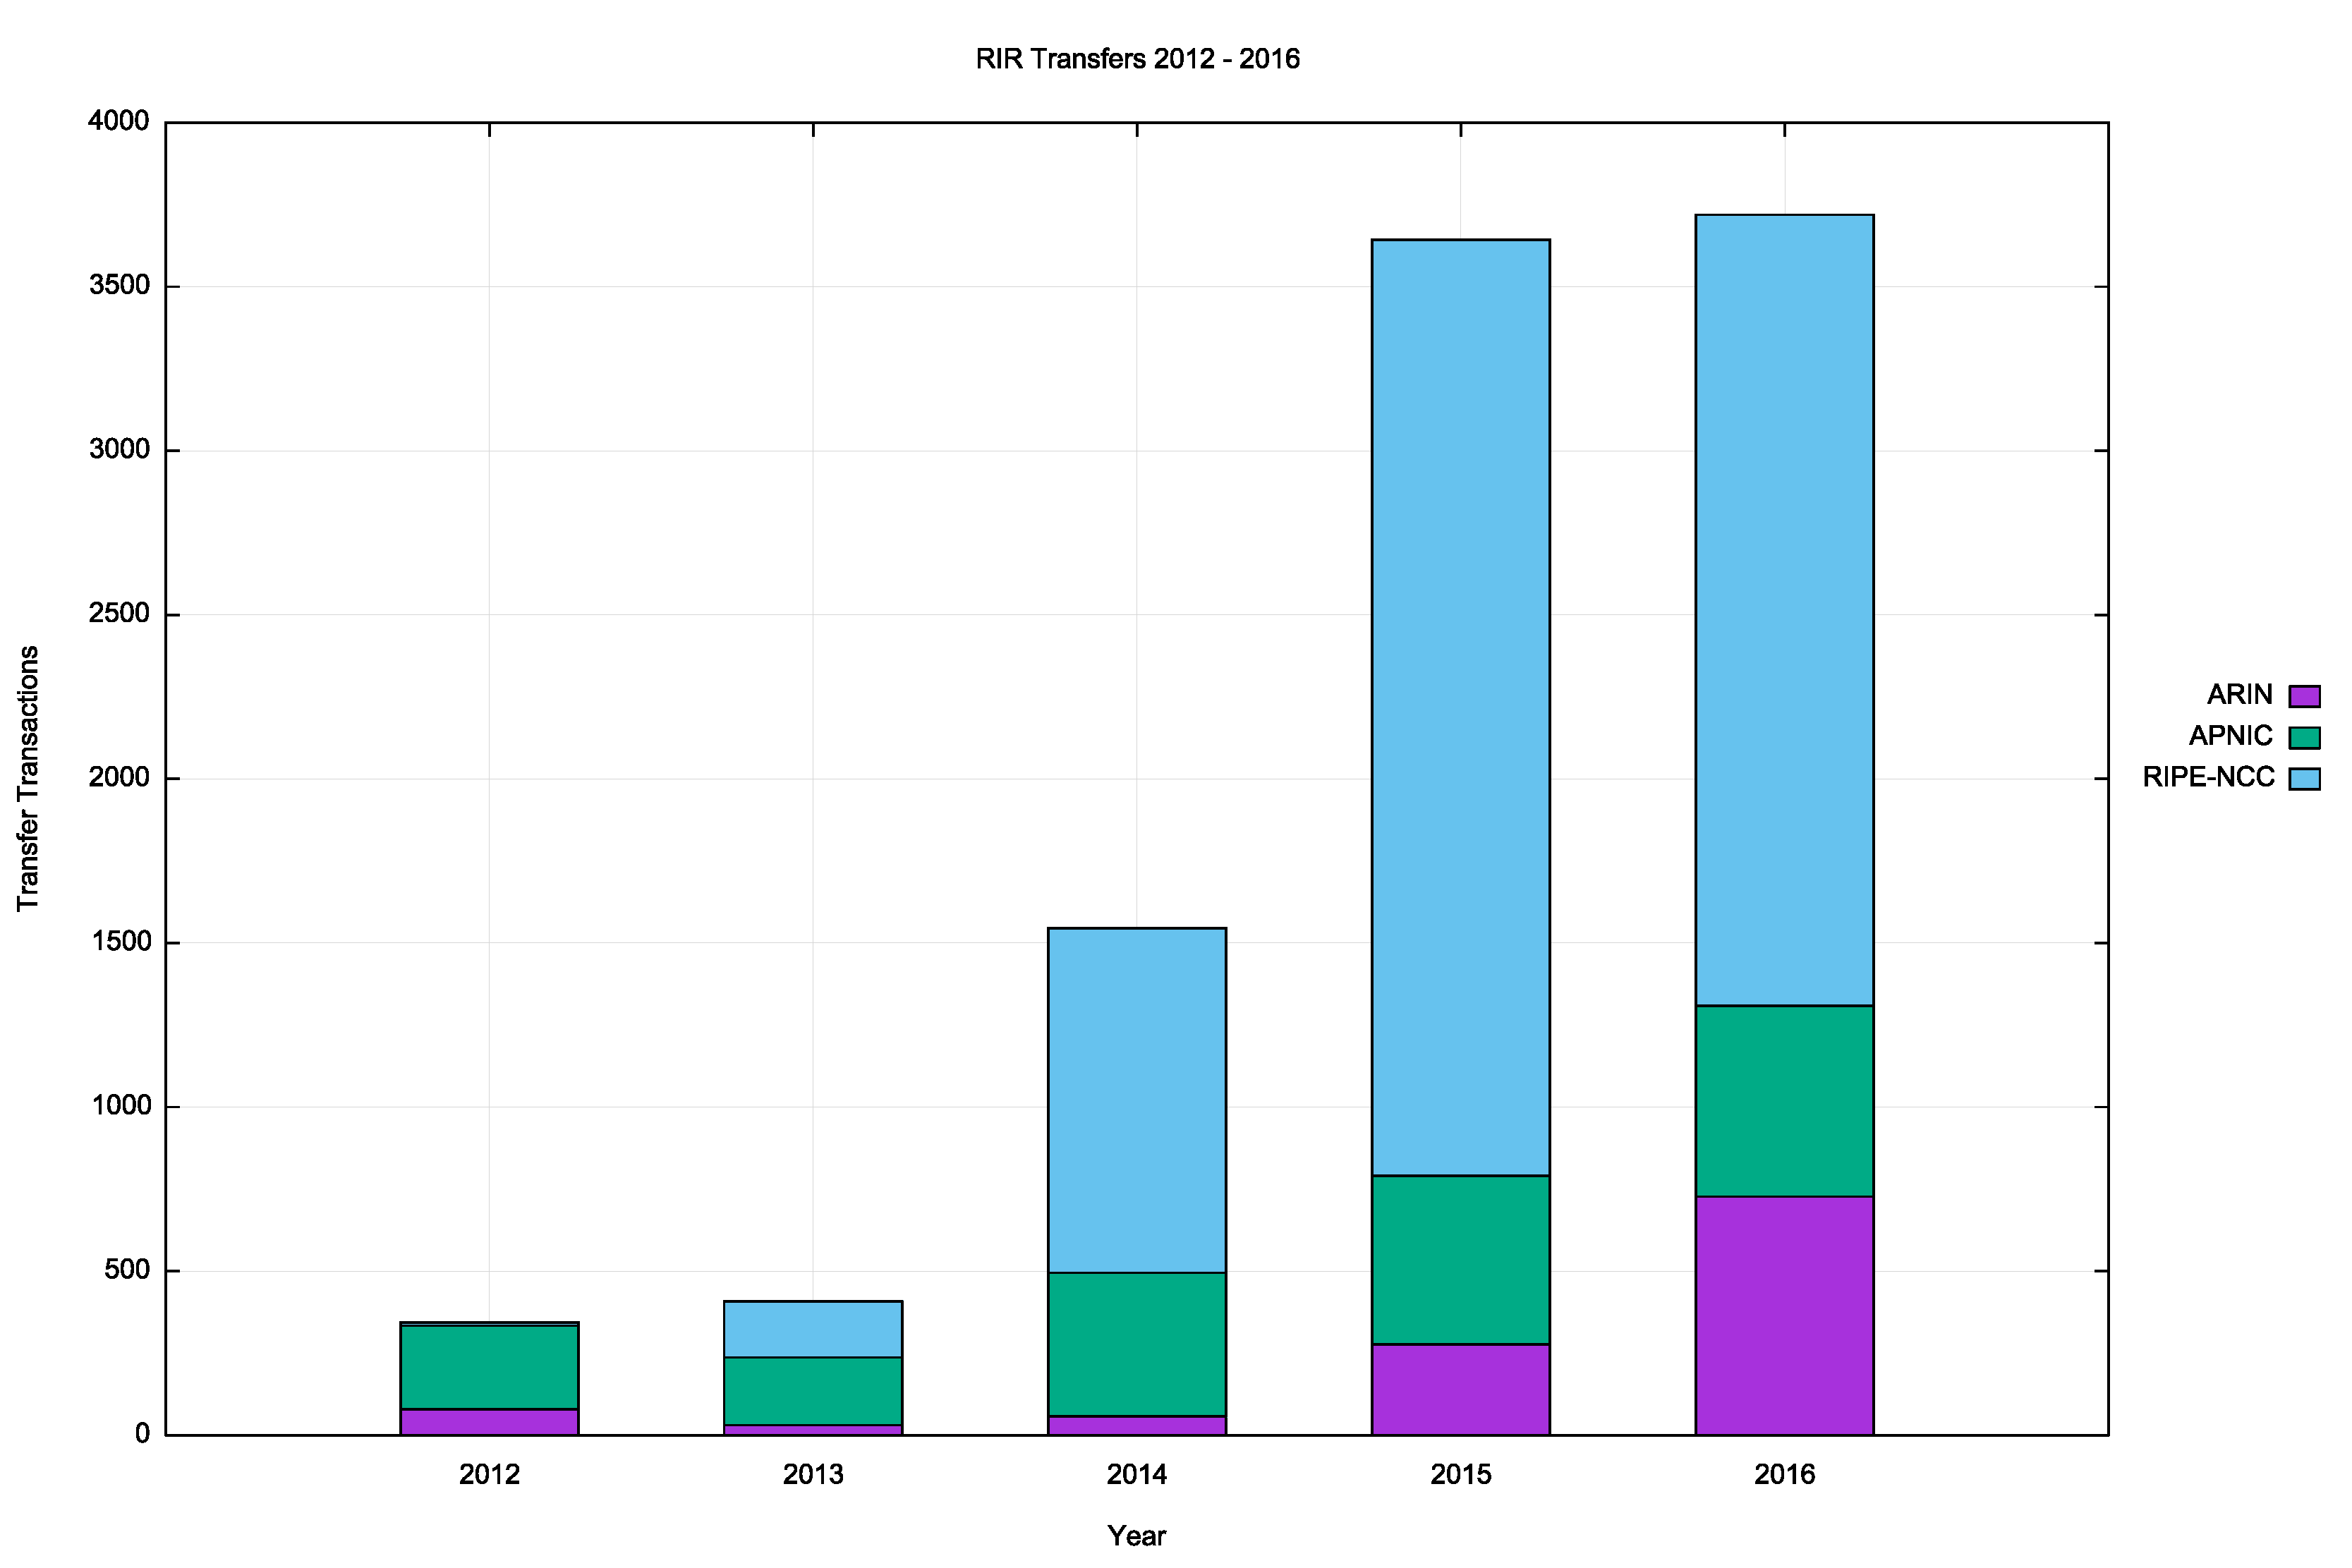 Figure 3 – Number of Transfers: 2012–2016
 Figure 4 – Volume of Transferred Addresses: 2012–2016
The total volume of addresses transferred in this way is approaching double the volume of allocated addresses. The aggregate total of addresses in the transfer logs is some 130 million addresses or the equivalent of 7.75 /8s.
This data raises some questions about the nature of transfers.
The first question is whether address transfers have managed to be effective in dredging the pool of unadvertised public IPv4 addresses? It was thought that by being able to monetize these addresses, holders of such addresses may have been motivated to convert their networks to use private addresses and resell their holding of public addresses. The numbers appear to show that this has happened, although progress has been slow.
At the onset of address exhaustion in 2011, the unadvertised pool was at the equivalent of 54 /8s and it was down to 48 /8s at the end of 2016 (Figure 5). In relative terms, the pool dropped from 27% of the total allocated address pool to 22% in the same period (Figure 6).
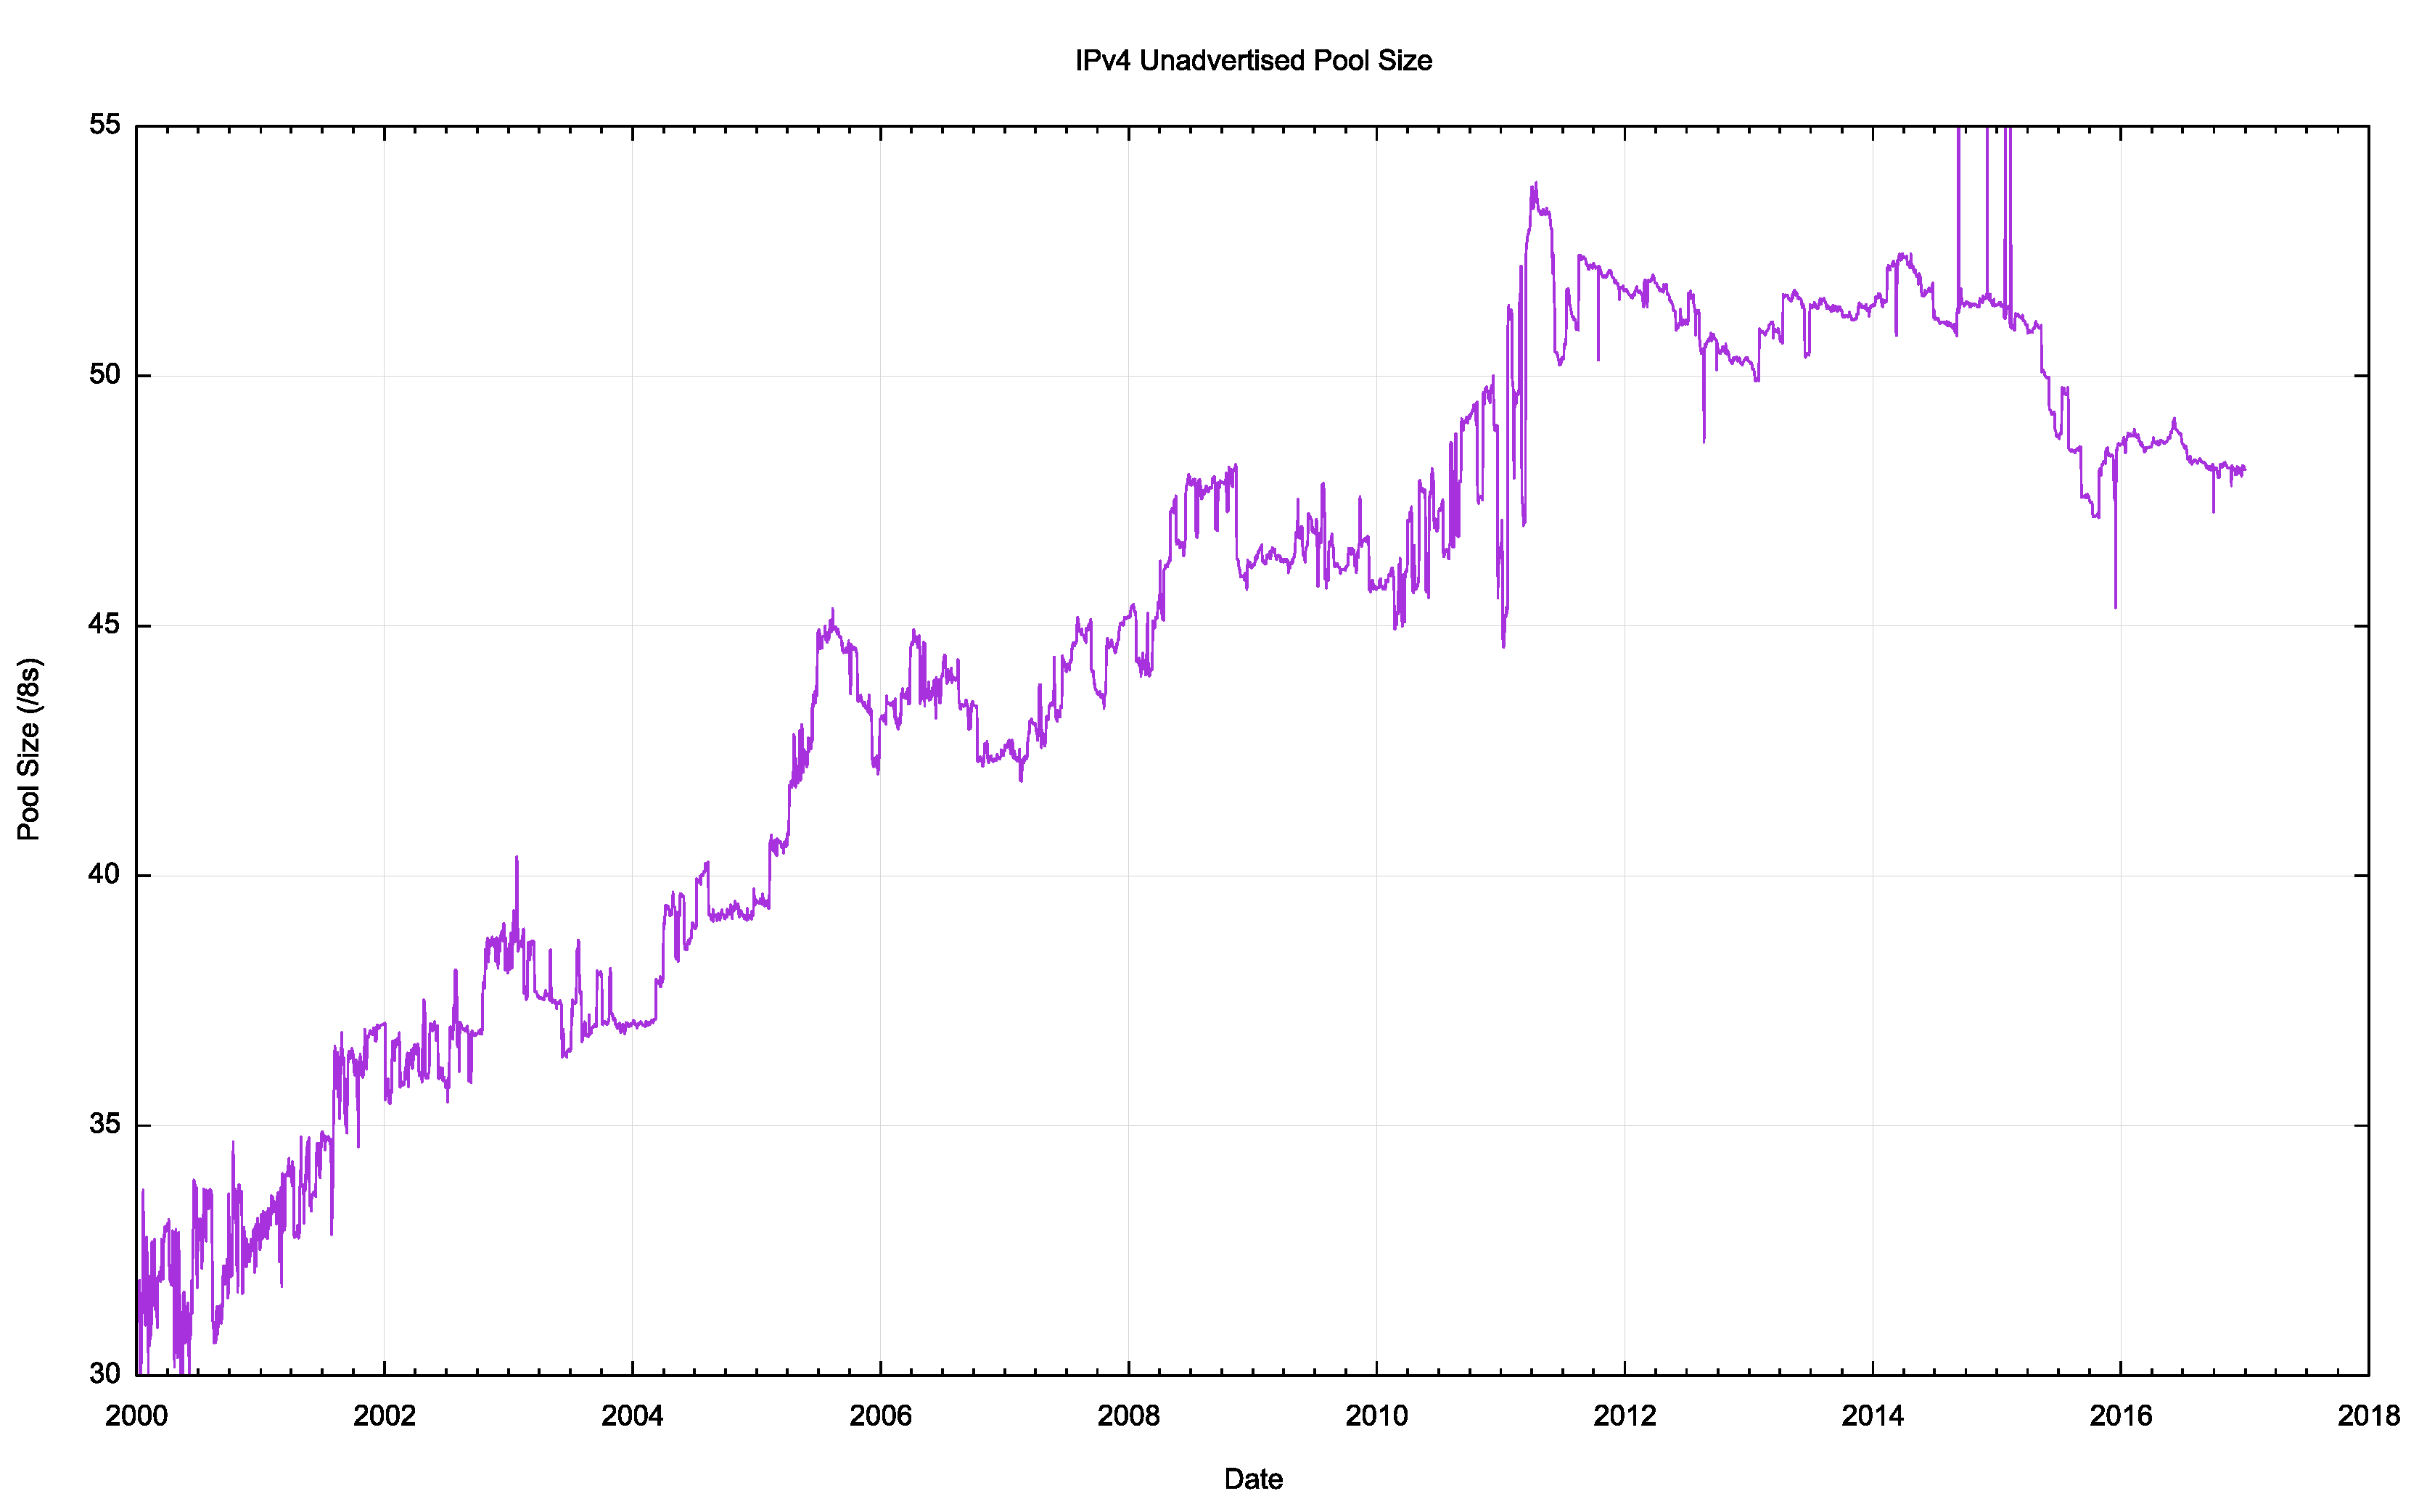 Figure 5 – IPv4 Unadvertised Address Pool size
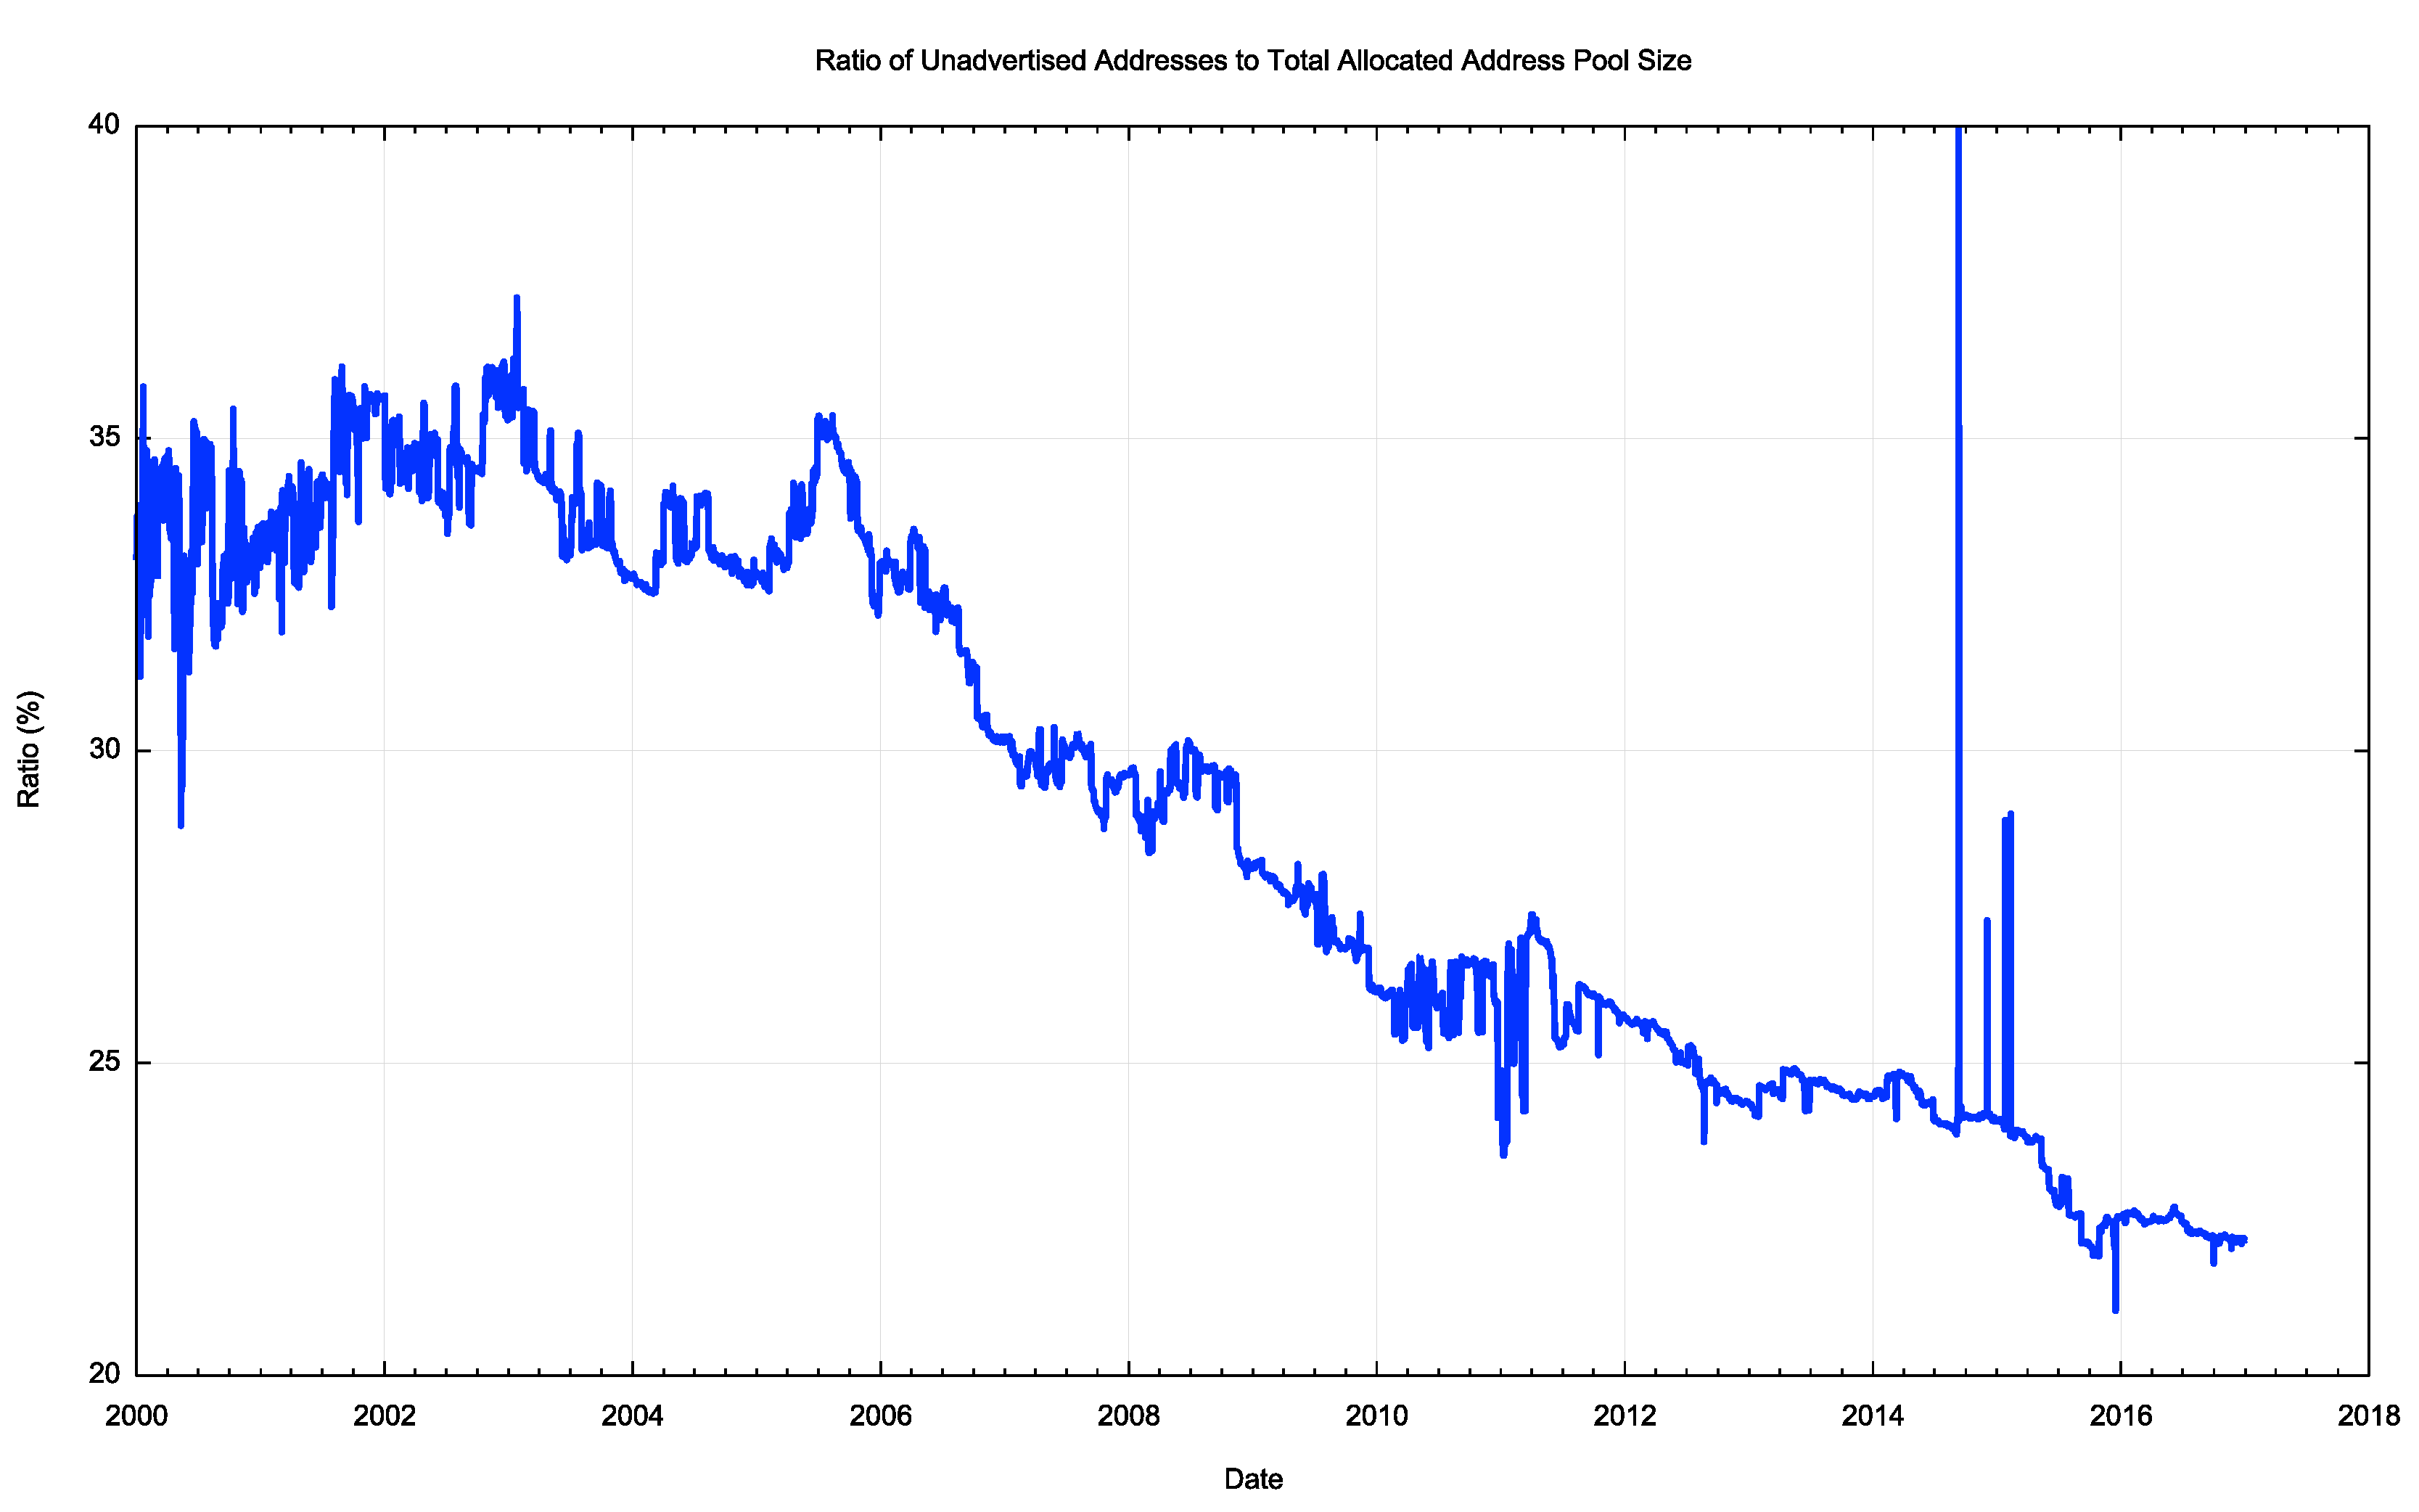 Figure 6 – Ratio of Unadvertised Pool to Total Pool
There is a slightly different aspect to this question, and this concerns whether the transferred addresses are: predominately recently allocated addresses, where there may be the potential for arbitrage between the costs of receiving an address allocation from an RIR and the potential returns from selling these address holdings on the transfer market; or longer held addresses where the holder is wanting to realize otherwise unused assets. The basic question concerns the “age” distribution of transferred addresses where the “age” of an address reflects the period since it was first allocated or assigned by the RIR system.
The cumulative age distribution of transferred addresses is shown on a year-by-year basis in Figure 7. In 2012, one-half of the transferred address blocks were originally assigned or allocated by an RIR within the previous 7 years. In 2016 this has dropped to 10% of transferred addresses. In 2012, 30% of transferred addresses had original registration dates older than 20 or more years in the past. In 2016 this number has risen to 70%. It appears that these days, most of the transferred addresses are delving into the original legacy address allocations and reusing them in new deployments.
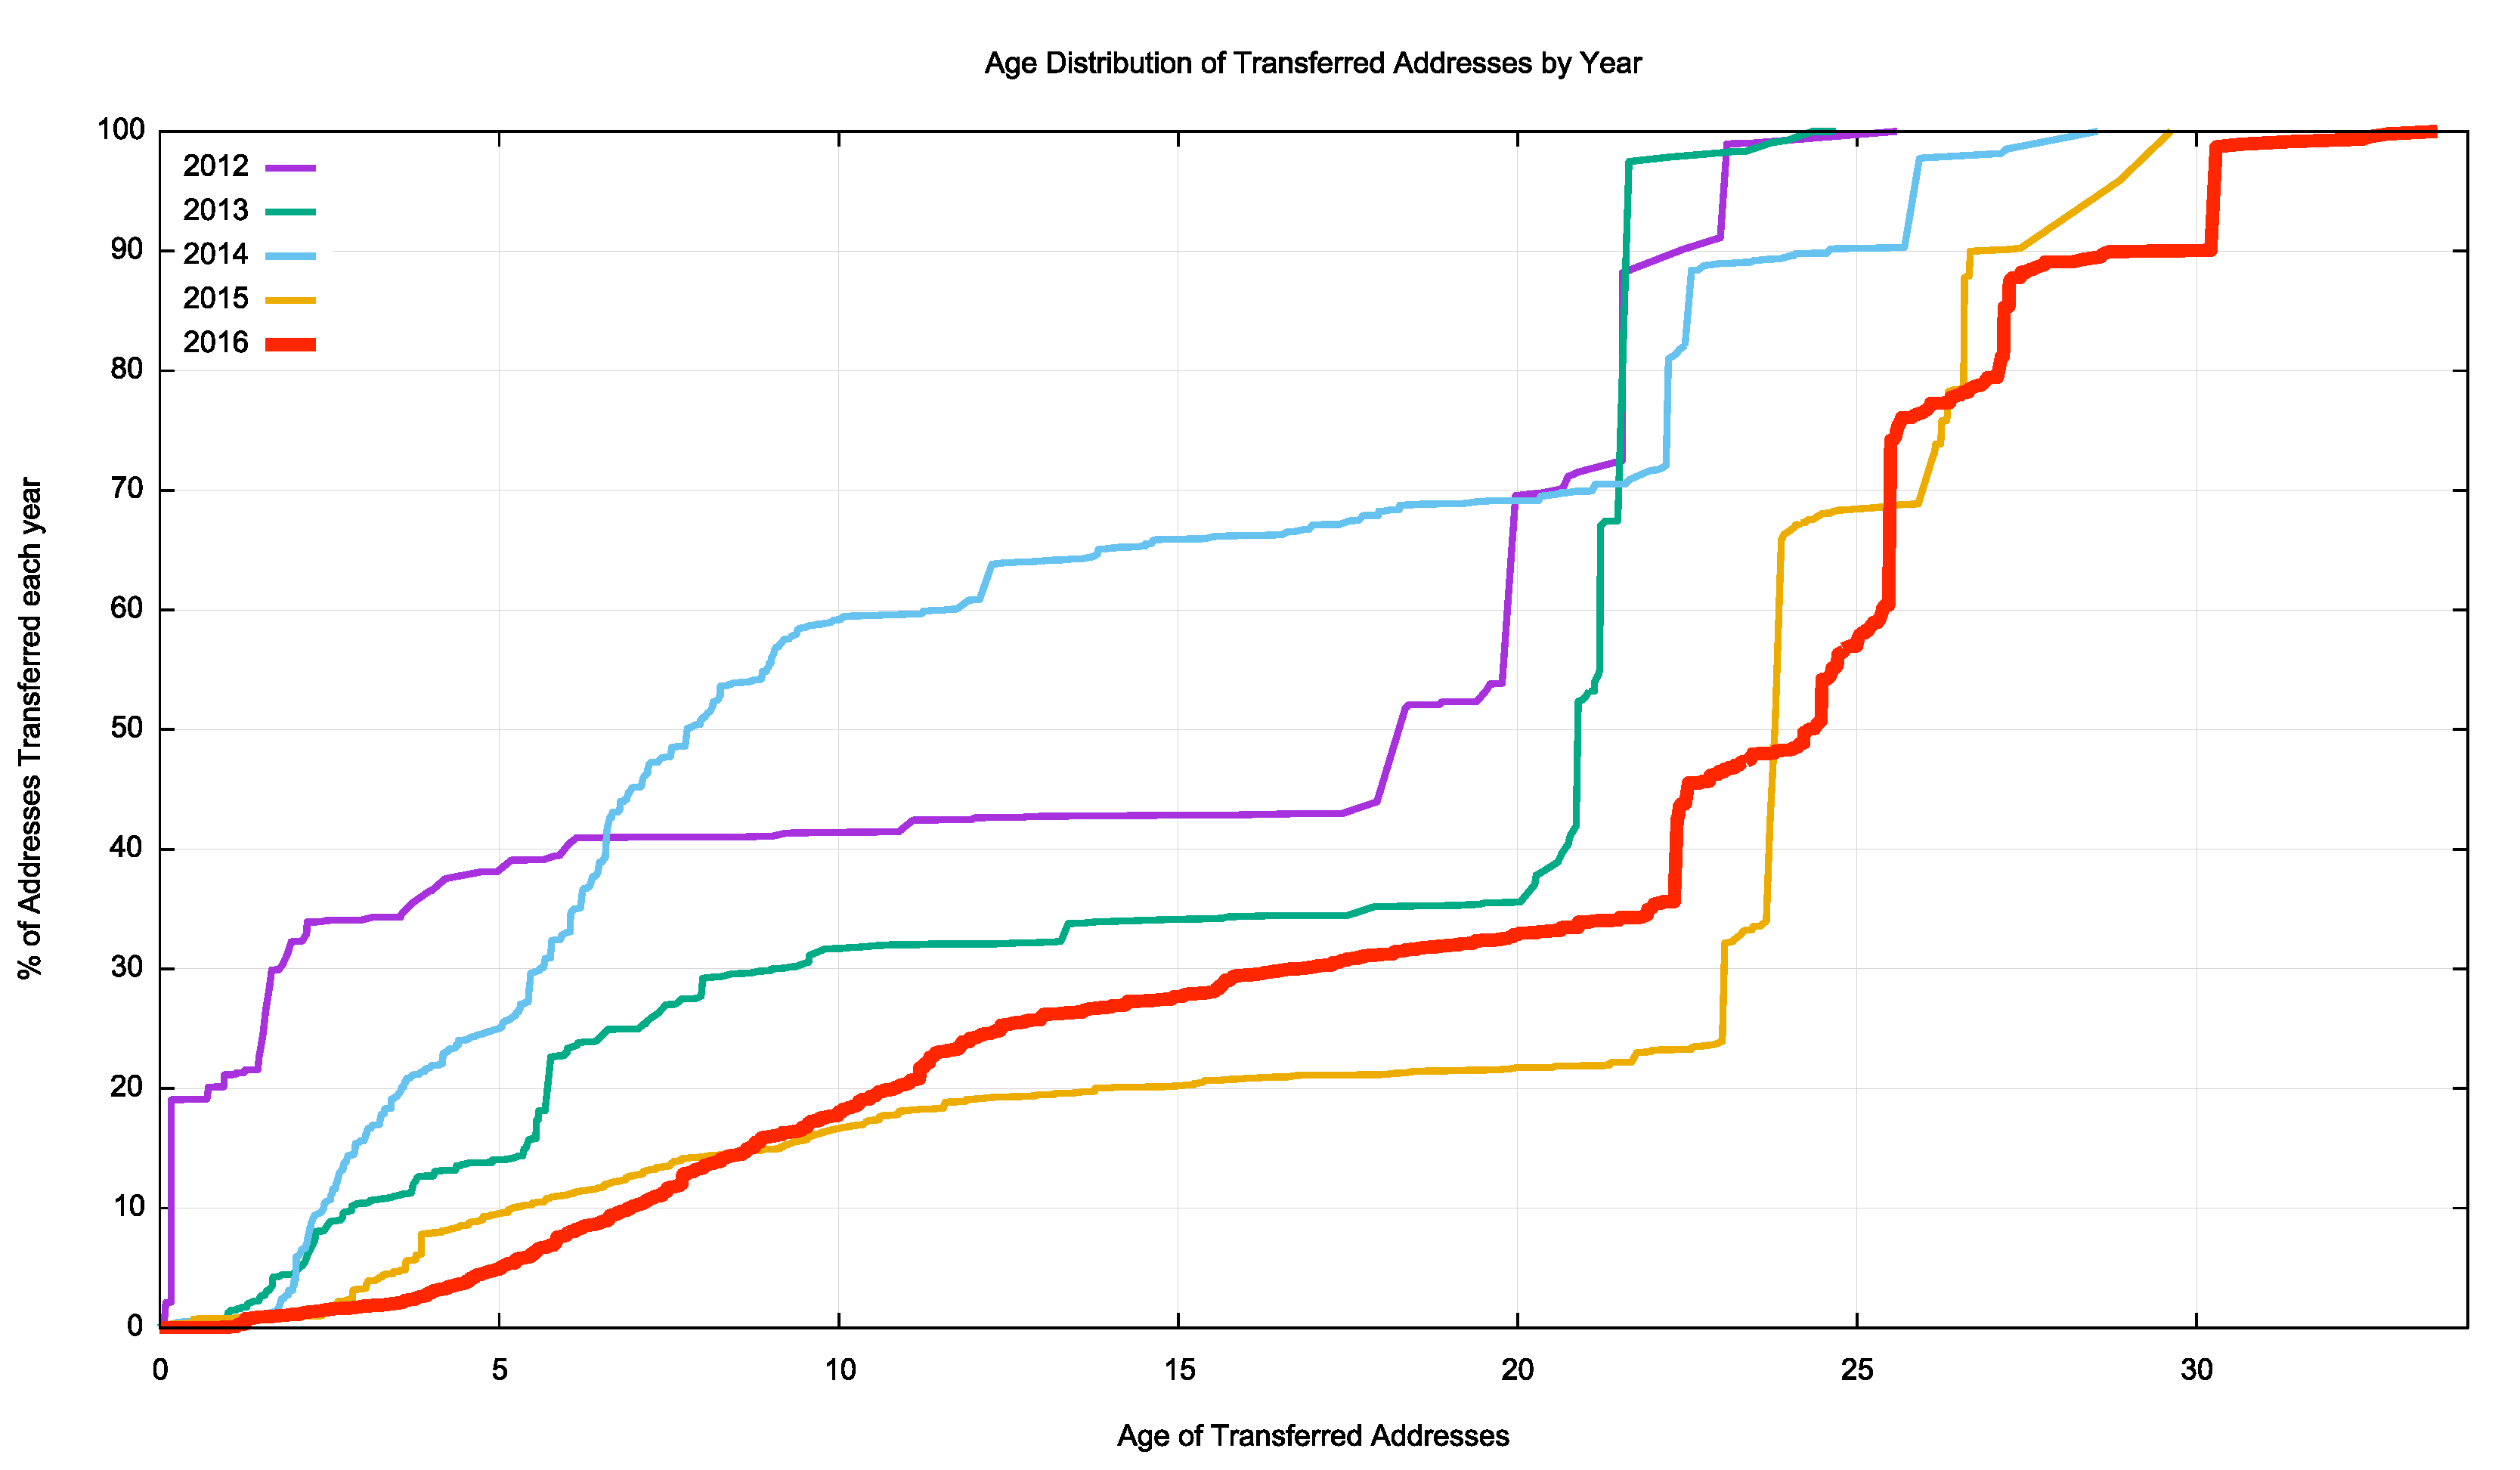
Figure 7 – Age distribution of transferred addresses 2012–2016
The second question is whether the transfer process is disaggregating the address space and splitting up larger address blocks into successively smaller address blocks.
There are 9,534 address blocks described in the transfer registries, and of these 6,930 entries list transferred address blocks that are smaller than the original allocated block. However, this could be a misleading number, in that the registry entry lists blocks that are not necessarily aligned to normal address prefix masks, while the transfer logs list the transferred blocks in conventional prefix and mask notation.
For example, a single registry entry for a transferred block of 768 addresses would be listed as two transfer transactions, one for a /24 and the second for a /23 in the transfer log. When this is taken into account, we have some 893 address blocks that have been split up into 5,196 smaller address blocks that have diverse address holders. In other words, some 54% of the listed transfers involve disaggregating an address block and distributing the smaller blocks to several holders.
In summary, it appears that address transfers involve some level of address disaggregation. On average, approximately one-sixth of the original address blocks that are transferred (17%) are split into smaller pieces with multiple holders, and on average this results in approximately six different holders of transferred address fragments.
The third question concerns the inter-country flow of transferred addresses. Let’s look at the ten countries that sourced the greatest volume of transferred addresses (Table 6), the ten largest recipients of transfers (Table 7), and the ten largest country-to-country address transfers (Table 8).
The transfer logs contain 6,474 domestic address transfers, with a total of 81,805,824 addresses, while 3,060 transfers appear to result in a movement of addresses between countries, involving a total of 39,777,792 addresses.
| Rank | CC | Addresses | Country Name |
|---|---|---|---|
| 1 | US | 67,903,232 | USA |
| 2 | CA | 13,445,888 | Canada |
| 3 | RO | 6,921,728 | Romania |
| 4 | RU | 4,234,240 | Russia |
| 5 | GB | 4,013,056 | UK |
| 6 | JP | 3,061,504 | Japan |
| 7 | DE | 3,023,616 | Germany |
| 8 | HK | 2,956,288 | Hong Kong |
| 9 | CN | 1,731,328 | China |
| 10 | AU | 1,429,504 | Australia |
Table 6 – Top 10 countries sourcing transferred IPv4 addresses
| Rank | CC | Addresses | Country Name |
|---|---|---|---|
| 1 | US | 67,330,816 | USA |
| 2 | CN | 7,230,976 | China |
| 3 | IN | 5,853,440 | India |
| 4 | JP | 4,676,096 | Japan |
| 5 | IR | 3,836,928 | Iran |
| 6 | RU | 3,119,616 | Russia |
| 7 | GB | 3,054,592 | UK |
| 8 | SA | 2,418,688 | Saudi Arabia |
| 9 | DE | 2,225,920 | Germany |
| 10 | AU | 1,862,912 | Australia |
Table 7 – Top 10 countries receiving transferred IPv4 addresses
| Rank | From-CC | To-CC | Addresses | From | To |
|---|---|---|---|---|---|
| 1 | US | US | 58,322,432 | USA | USA |
| 2 | CA | US | 8,785,408 | Canada | USA |
| 3 | US | IN | 4,150,528 | USA | India |
| 4 | JP | JP | 2,989,568 | Japan | Japan |
| 5 | RU | RU | 2,940,416 | Russia | Russia |
| 6 | GB | GB | 2,513,920 | UK | UK |
| 7 | CA | CN | 2,359,296 | Canada | China |
| 8 | HK | CN | 1,934,848 | Hong Kong | China |
| 9 | RO | SA | 1,656,832 | Romania | Saudi Arabia |
| 10 | CN | CN | 1,655,552 | China | China |
Table 8 – Top 10 country-to-country IPv4 address transfers
The total volume of addresses reassigned in this manner, some 121 million IPv4 addresses over four years, is far less than the underlying pre-exhaustion address demand levels that peaked at some 250 million addresses in a single year. It appears that the address supply hiatus has motivated most providers to use address sharing technologies, and, in particular, Carrier Grade NAT (CGN), on the access side and server pooling on the content side as a means of increasing the level of sharing of addresses.
The outstanding question about this transfer data is whether all address transfers that have occurred have been duly recorded in the registry system. This question is raised because registered transfers require conformance to various registry policies, and it may be the case that only a subset of transfers is being recorded in the registry as a result. This can be somewhat challenging to detect, particularly if such a transfer is expressed as a lease or other form of temporary arrangement, and if the parties agree to keep the details of the transfer confidential.
But it might be possible to place an upper bound on the volume of address movements that have occurred in any period to look at the Internet’s routing system. One way to shed some further light on what this upper bound on transfers might be is through a simple examination of the routing system, looking at addresses that were announced in 2016 by comparing the routing stable state at the start of the year with the table state at the end of the year (Figure 8).
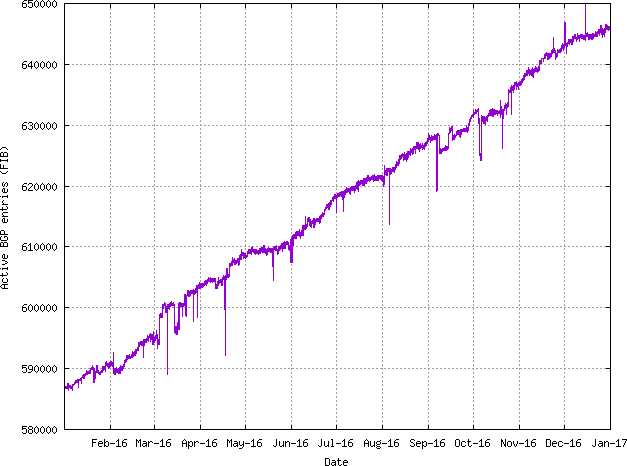
Figure 8 – Change in the size of the BGP routing table across 2016
While the routing table grew by 59,141 entries over the year, the nature of the change is slightly more involved. Some 67,504 prefixes that were announced at the start of the year were removed from the routing system throughout the year, and 126,645 prefixes were announced by the end of the year that were not announced at the start of the year. (I have not tracked the progress of announcements through the year, and it is likely that more prefixes were announced and removed on a transient basis through the course of the year.) A further 16,928 prefixes had changed their originating Autonomous System Number, indicating some form of change in the prefix’s network location in some manner (Table 9).
| Jan-16 | Jan-17 | Delta | Unchanged | Re-Homed | Removed | Added | |
|---|---|---|---|---|---|---|---|
| Announcements | 586,918 | 646,059 | 59,141 | 502,846 | 16,928 | 67,504 | 126,645 |
| Root Prefixes | 286,249 | 309,902 | 23,653 | 252,411 | 10,803 | 20,080 | 46,238 |
| Address span (/8s) | 156.35 | 158.40 | 2.05 | 147.31 | 2.52 | 5.58 | 8.57 |
| More Specifics | 300,699 | 336,967 | 36,268 | 250,435 | 6,125 | 45,424 | 80,407 |
| Address Count (/8s) | 51.86 | 56.04 | 4.18 | 47.06 | 0.81 | 4.94 | 8.17 |
Table 9 – Routing changes across 2016
We can compare these changed prefixes against the transfer logs for 2016. Table 10 shows the comparison of these routing numbers against the set of transfers that were logged in 2016.
| Type | Registered Transfer | Unlisted | Ratio |
|---|---|---|---|
| Re-Homed | |||
| All | 1,539 | 15,389 | 9.1% |
| Root Prefixes | 1,184 | 9,551 | 11.0% |
| Removed | |||
| All | 3,287 | 64,287 | 4.9% |
| Root Prefixes | 1,877 | 20,203 | 8.5% |
| Added | |||
| All | 8,663 | 117,982 | 6.8% |
| Root Prefixes | 4,617 | 41,621 | 10.0% |
Table 10 – Routing changes across 2016 compared to the Transfer Logs
These figures show that 5 to 10% of changes in advertised addresses are reflected as changes as recorded in the transfers. This should not imply that the remaining 90 to 95% of changes in advertised prefixes reflect unrecorded address transfers. There are many reasons for changes in the advertisement of an address prefix and a change in the controller of the address is only one potential cause.
However, it does establish some notional upper ceiling on the number of movements of addresses in 2016, some of which relate to transfer of operational control of an address block, that have not been captured in the transfer logs.
Finally, we can perform an age profile of the addresses that were added, removed and re-homed during 2016, and compare it to the overall age profile of IPv4 addresses. This is shown in Figure 9.
The addresses that were added in 2016 differ from the average profile due to a skew in favour of “recent” addresses, and 20% of all announced addresses were allocated or assigned in the past 18 months. In terms of addresses that were removed from the routing system, there is a disproportionate volume of removed addresses that are between 2 and 10 years old. 20% of removed addresses are more than 20 years old, and almost 40% of all registered addresses are more than 20 years old. Addresses that were re-homed appear to be disproportionally represented in the age bracket of between 7 to 15 years old.
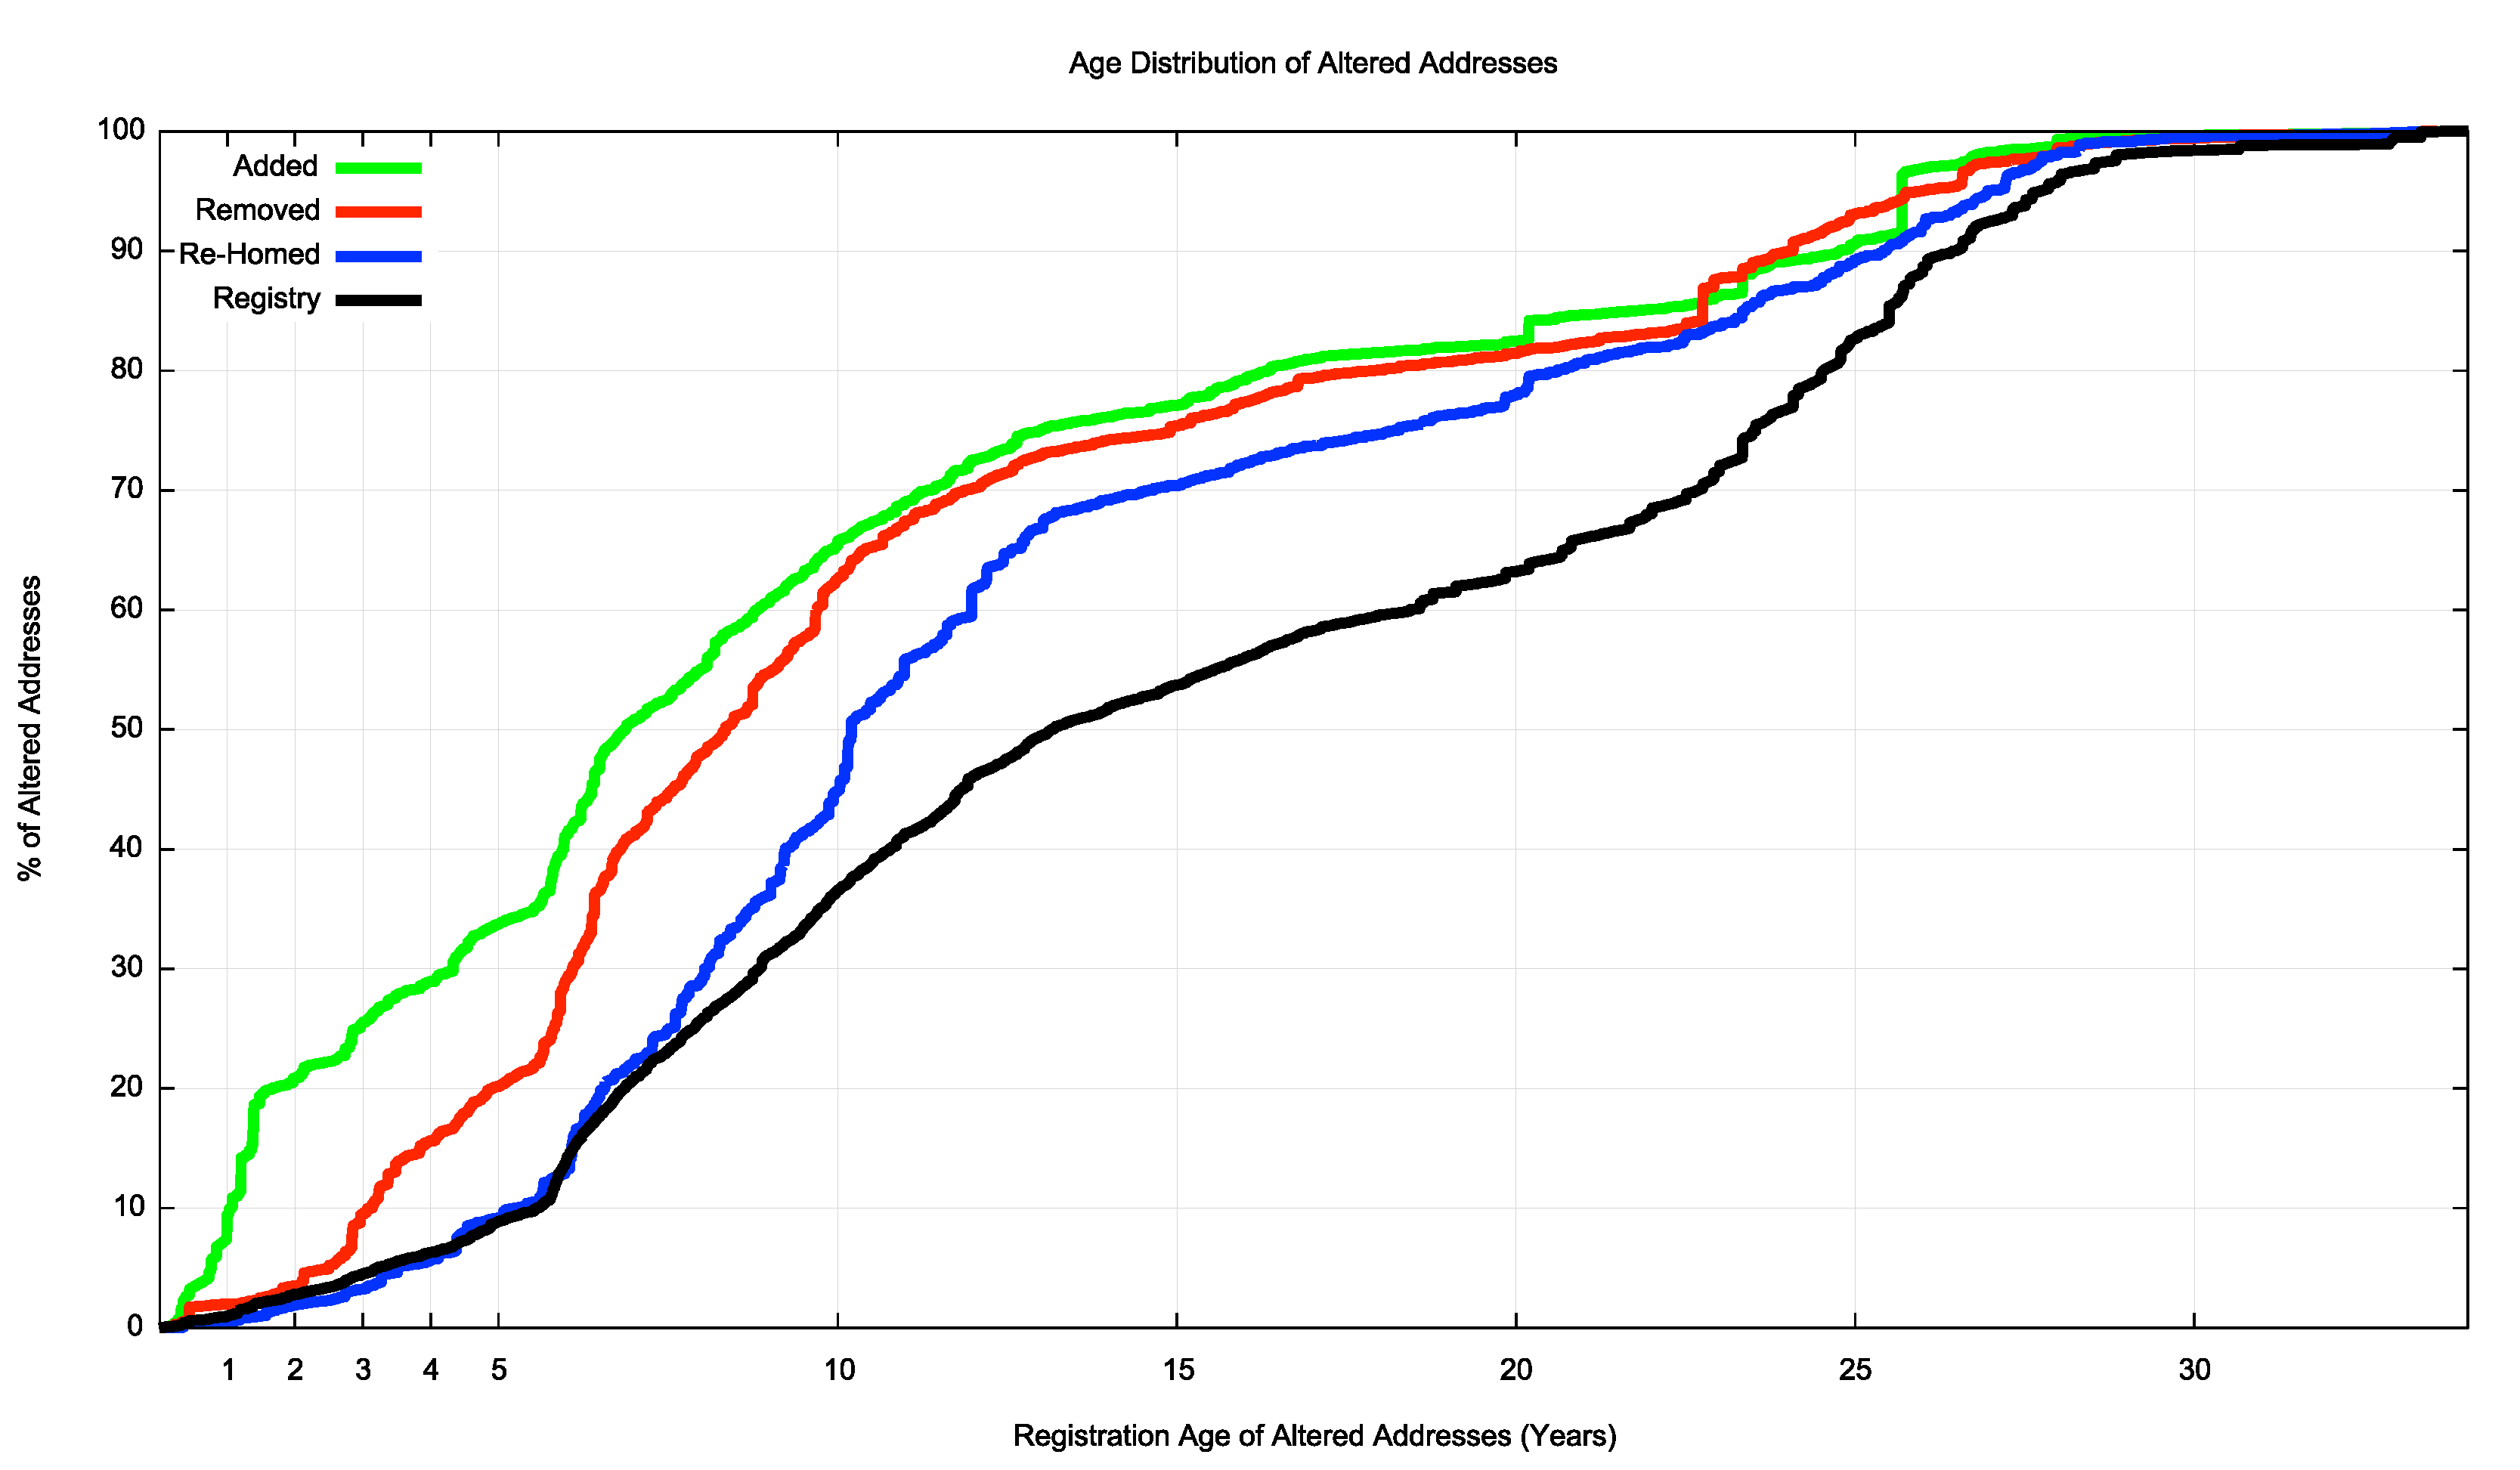
Figure 9 – Age profile of addresses that were added, removed and re-homed during 2016
IPv6 in 2016
Obviously, IPv4 address allocations are only half of the story, and to complete the picture it’s necessary to look at how IPv6 has fared over 2016.
IPv6 uses a somewhat different address allocation methodology than IPv4, and it is a matter of choice for a service provider as to how large an IPv6 address prefix is assigned to each customer. The original recommendations published by the IAB and IESG in 2001, documented in RFC3177, envisaged the general use of a /48 as an end site prefix. Subsequent consideration of long term address conservation saw a more flexible approach being taken with the choice of the end site prefix size being left to the service provider.
Today’s IPv6 environment has some providers using a /60 end site allocation unit, many use a /56, and other providers use a /48. This variation makes a comparison of the count of allocated IPv6 addresses somewhat misleading, as an ISP using /48’s for end sites will require 256 times more address space to accommodate a similarly sized same customer base as a provider who uses a /56 end site prefix, and 262,000 times more address space than an ISP using a /60 end site allocation!
For IPv6, let’s use both the number of discrete IPv6 allocations and the total amount of space that was allocated to see how IPv6 fared in 2016.
Comparing 2015 to 2016, the number of individual allocations of IPv6 address space has risen by some 20%. By contrast, the number of IPv4 allocations has fallen by 16% in this same period (Table 11).
| Allocations | 2007 | 2008 | 2009 | 2010 | 2011 | 2012 | 2013 | 2014 | 2015 | 2016 |
|---|---|---|---|---|---|---|---|---|---|---|
| IPv6 | 473 | 841 | 1,243 | 2,477 | 3,700 | 3,403 | 3,840 | 4,407 | 4,733 | 5,594 |
| IPv4 | 6,312 | 6,969 | 6,701 | 7,758 | 10,061 | 8,619 | 7,110 | 10,853 | 11,732 | 9,787 |
Table 11 – Number of individual address allocations, 2007–2016
The amount of IPv6 address space distributed in 2013 had risen by some 40% over 2012 levels, but in 2014 the total volume of allocated addresses fell by the same amount, back to the same total volume of addresses as in 2012. The number of allocations increased, however, indicating that in 2014 there were no anomalous extremely-large allocations of IPv6 address space. 2015 showed a visible level of growth over 2014 levels in IPv6 (Table 12).
| Addresses | 2007 | 2008 | 2009 | 2010 | 2011 | 2012 | 2013 | 2014 | 2015 | 2016 |
|---|---|---|---|---|---|---|---|---|---|---|
| IPv6 (/32s) | 6,916 | 15,634 | 1,555 | 4,754 | 20,009 | 18,136 | 23,935 | 17,513 | 20,225 | 25,301 |
| IPv4 (/32s)(M) | 203.9 | 203.3 | 189.4 | 248.8 | 201.0 | 114.9 | 65.1 | 63.9 | 34.8 | 22.2 |
Table 12 – Volume of address allocations, 2007–2016
Regionally, each of the RIRs saw IPv6 allocation activity in 2016 that was on a par with those seen in the previous year (Table 13).
| Allocations | 2007 | 2008 | 2009 | 2010 | 2011 | 2012 | 2013 | 2014 | 2015 | 2016 | |
|---|---|---|---|---|---|---|---|---|---|---|---|
| RIPE NCC | 150 | 413 | 595 | 1,012 | 1,565 | 1,661 | 2,057 | 2,143 | 2,206 | 2,141 | |
| ARIN | 196 | 213 | 357 | 567 | 959 | 545 | 523 | 505 | 602 | 646 | |
| APNIC | 61 | 158 | 185 | 637 | 610 | 561 | 505 | 503 | 778 | 1,681 | |
| LACNIC | 38 | 43 | 93 | 212 | 447 | 560 | 683 | 1,196 | 1,061 | 1,010 | |
| AFRINIC | 18 | 14 | 13 | 49 | 119 | 76 | 72 | 60 | 86 | 116 | |
| Total | 473 | 841 | 1,243 | 2,477 | 3,700 | 3,403 | 3,840 | 4,407 | 4,733 | 5,594 |
Table 13 – IPv6 allocations by RIR, 2007-2016
The assignment data tells a slightly different story. Table 14 shows the number of allocated IPv6 /32s per year. Interestingly the volume of IPv6 addresses assigned by ARIN in 2015, the year that ARIN exhausted its remaining pools of available IPv4 space, was approximately one tenth of the address volume of the previous year. The opposite was seen in AFRINIC, where the 2015 address volumes were ten times the 2014 volumes. This is largely due to two large IPv6 allocations in 2015 to Telecom SA (/20) and Vodacom SA (/24).
| IPv6 Addresses (/32s) | 2007 | 2008 | 2009 | 2010 | 2011 | 2012 | 2013 | 2014 | 2015 | 2016 | |
|---|---|---|---|---|---|---|---|---|---|---|---|
| RIPE NCC | 1,468 | 964 | 1,052 | 2,406 | 3,174 | 3,892 | 6,286 | 8,217 | 12,031 | 21,707 | |
| ARIN | 148 | 14,486 | 236 | 780 | 6,344 | 1,660 | 12,558 | 5,241 | 641 | 1,088 | |
| APNIC | 5,236 | 139 | 170 | 1,335 | 9,486 | 3,783 | 4,442 | 2,644 | 2,109 | 1,236 | |
| LACNIC | 51 | 35 | 87 | 197 | 948 | 4,605 | 597 | 1,359 | 974 | 1,182 | |
| AFRINIC | 13 | 10 | 9 | 36 | 147 | 4,196 | 51 | 51 | 4,471 | 78 | |
| Total | 6,916 | 5,634 | 1,555 | 4,754 | 20,099 | 8,136 | 23,935 | 17,513 | 20,225 | 25,301 |
Table 14 – IPv6 address allocation volumes by RIR
Dividing addresses by allocations gives the average IPv6 allocation size in each region (Table 15). The average allocation size for RIPE NCC has effectively doubled from a /30 to a /29 between 2015 and 2016, while it halved in APNIC from a /31 to a /32. There was a large IPv6 allocation by AFRINIC in 2015, which had no counterpart in 2016, so the allocation size is back to a /33. Overall, the average IPv6 allocation size remains a /30.
| Avg IPv6 Allocation | 2007 | 2008 | 2009 | 2010 | 2011 | 2012 | 2013 | 2014 | 2015 | 2016 | |
|---|---|---|---|---|---|---|---|---|---|---|---|
| RIPE NCC | /28.7 | /30.8 | /31.2 | /30.8 | /31.0 | /30.8 | /30.4 | /30.1 | /29.6 | /28.7 | |
| ARIN | /32.4 | /25.9 | /32.6 | /31.5 | /29.3 | /30.4 | /27.4 | /28.6 | /31.9 | /31.2 | |
| APNIC | /25.6 | /32.2 | /32.1 | /30.9 | /28.0 | /29.2 | /28.9 | /29.6 | /30.6 | /32.4 | |
| LACNIC | /31.6 | /32.3 | /32.1 | /32.1 | /30.9 | /29.0 | /32.2 | /31.8 | /32.1 | /31.8 | |
| AFRINIC | /32.5 | /32.5 | /32.5 | /32.4 | /31.7 | /26.2 | /32.5 | /32.2 | /26.3 | /32.6 | |
| All | /28.1 | /27.8 | /31.7 | /31.1 | /29.6 | /29.6 | /29.4 | /30.0 | /29.9 | /29.8 |
Table 15 – Average IPv6 address allocation size by RIR
The number and volume of IPv6 allocations per RIR, per year, is shown in Figures 10 and 11.
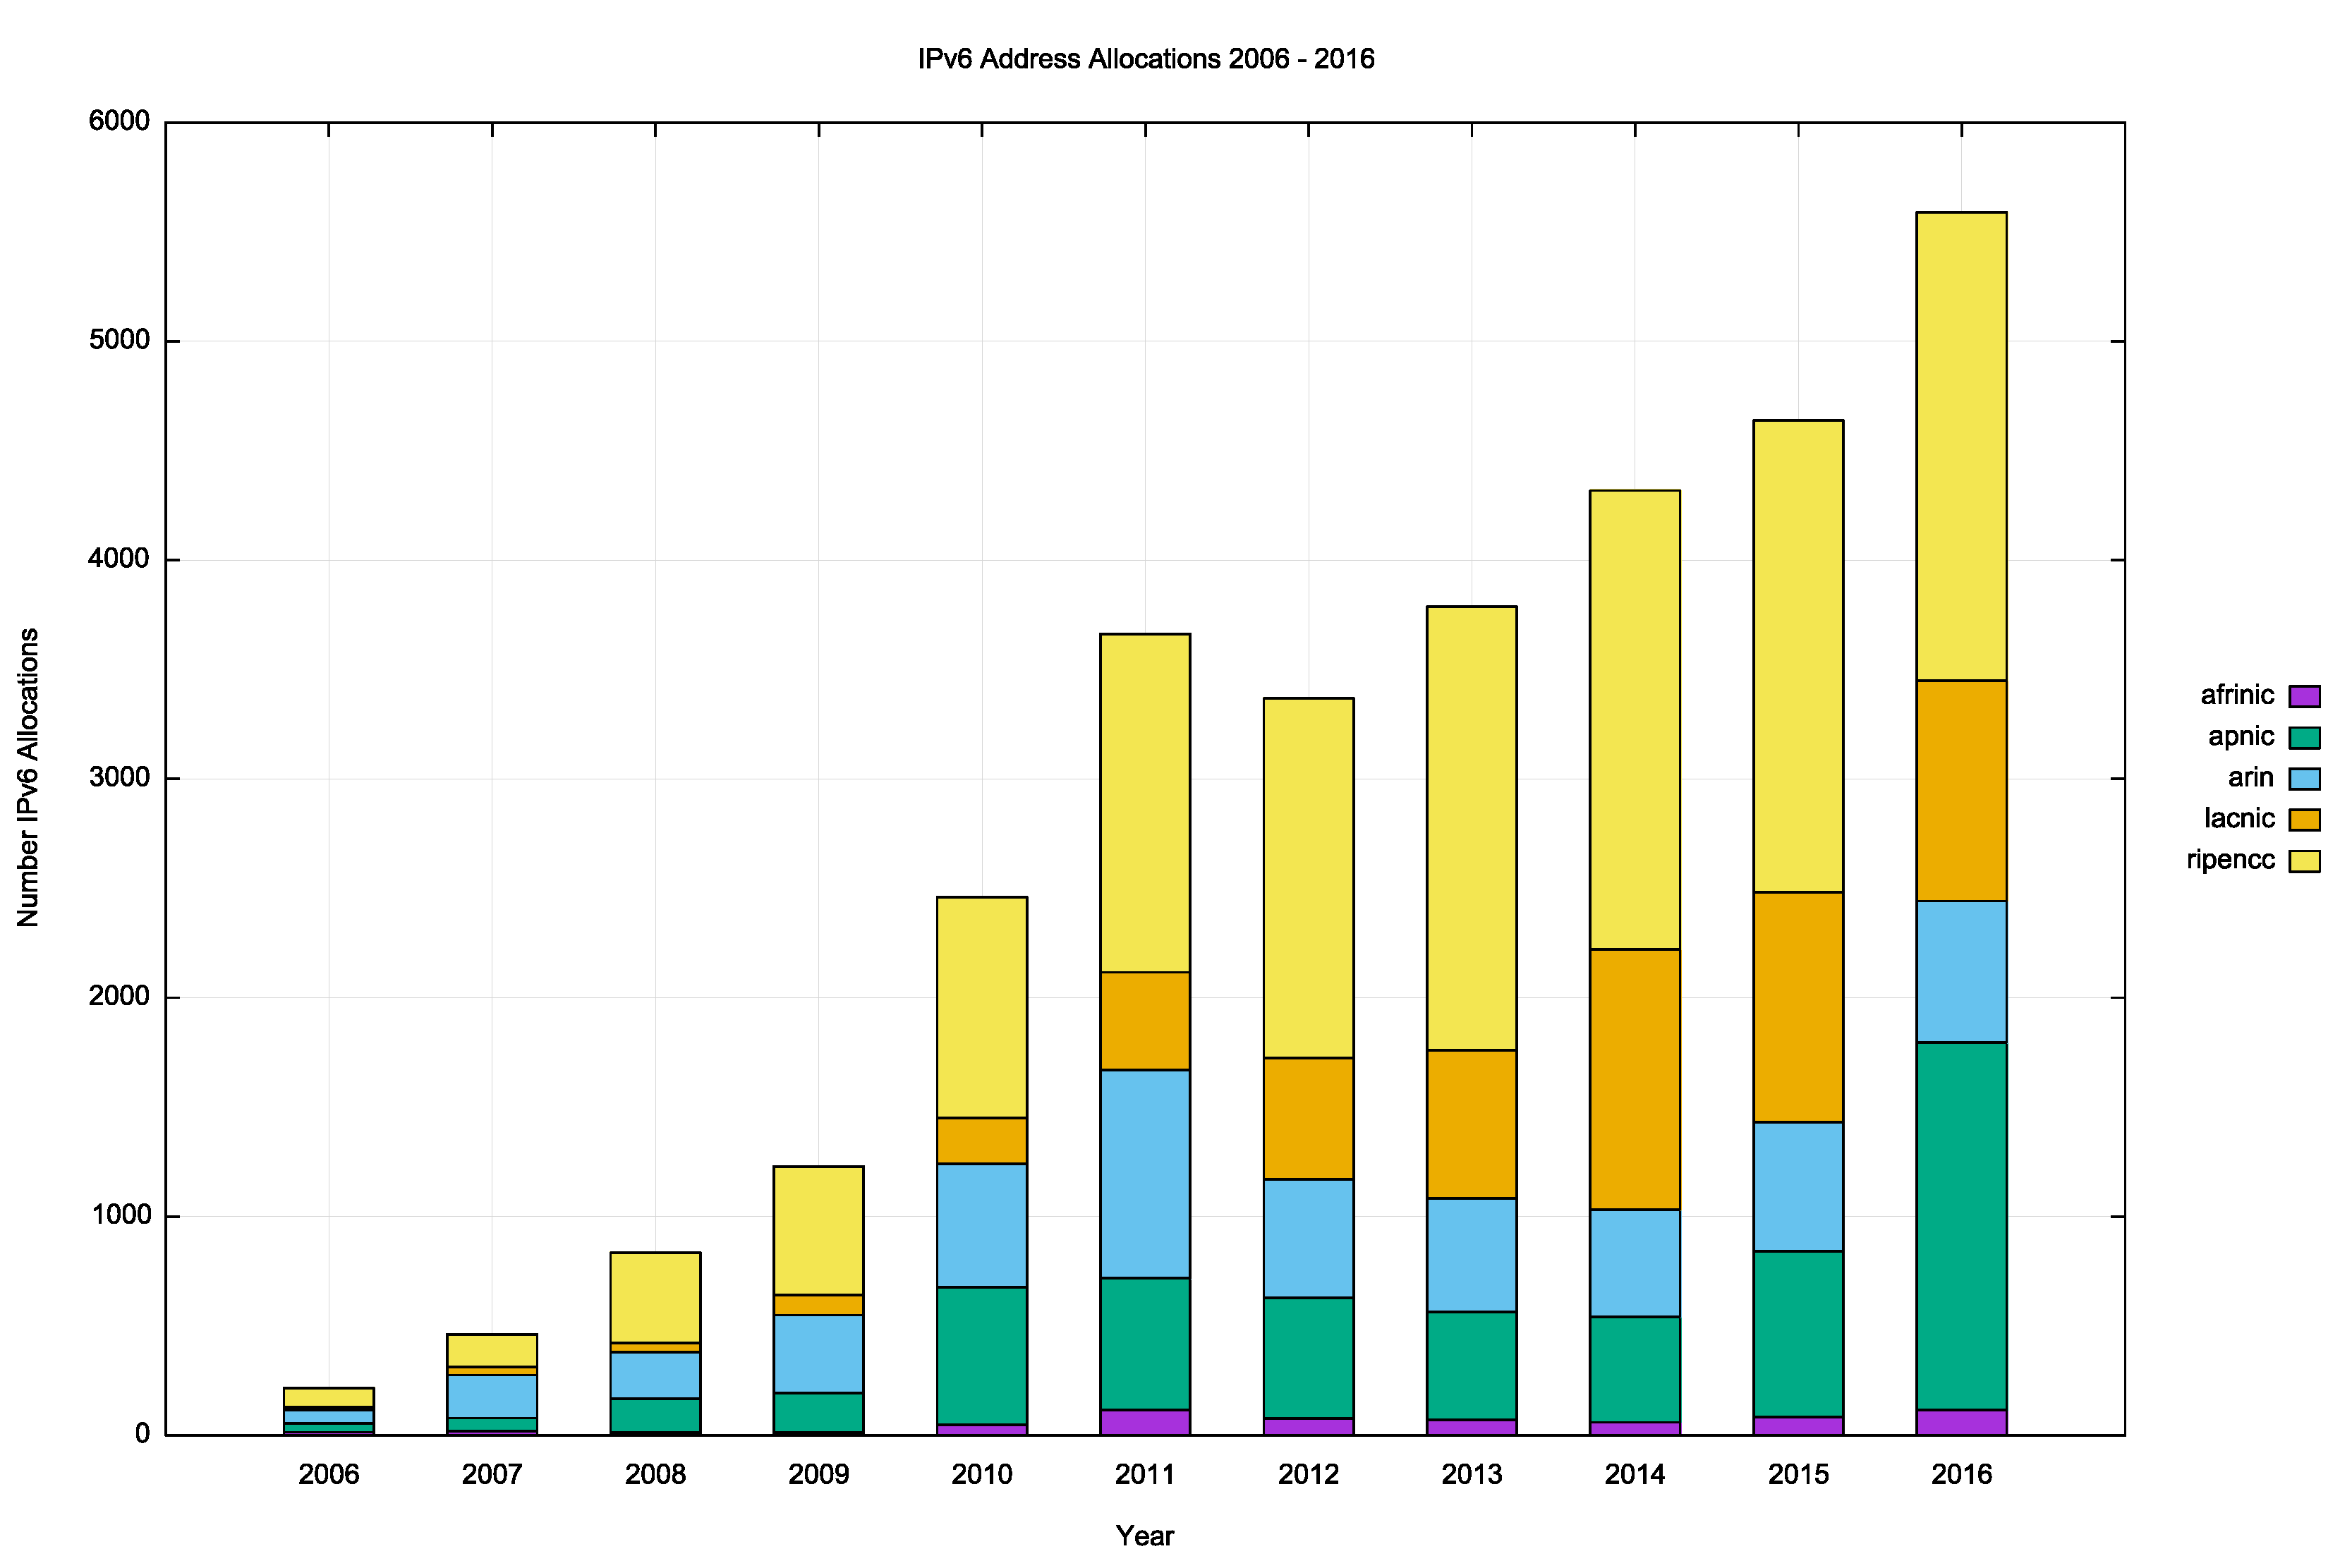 Figure 10 – Number of IPv6 Allocations per year
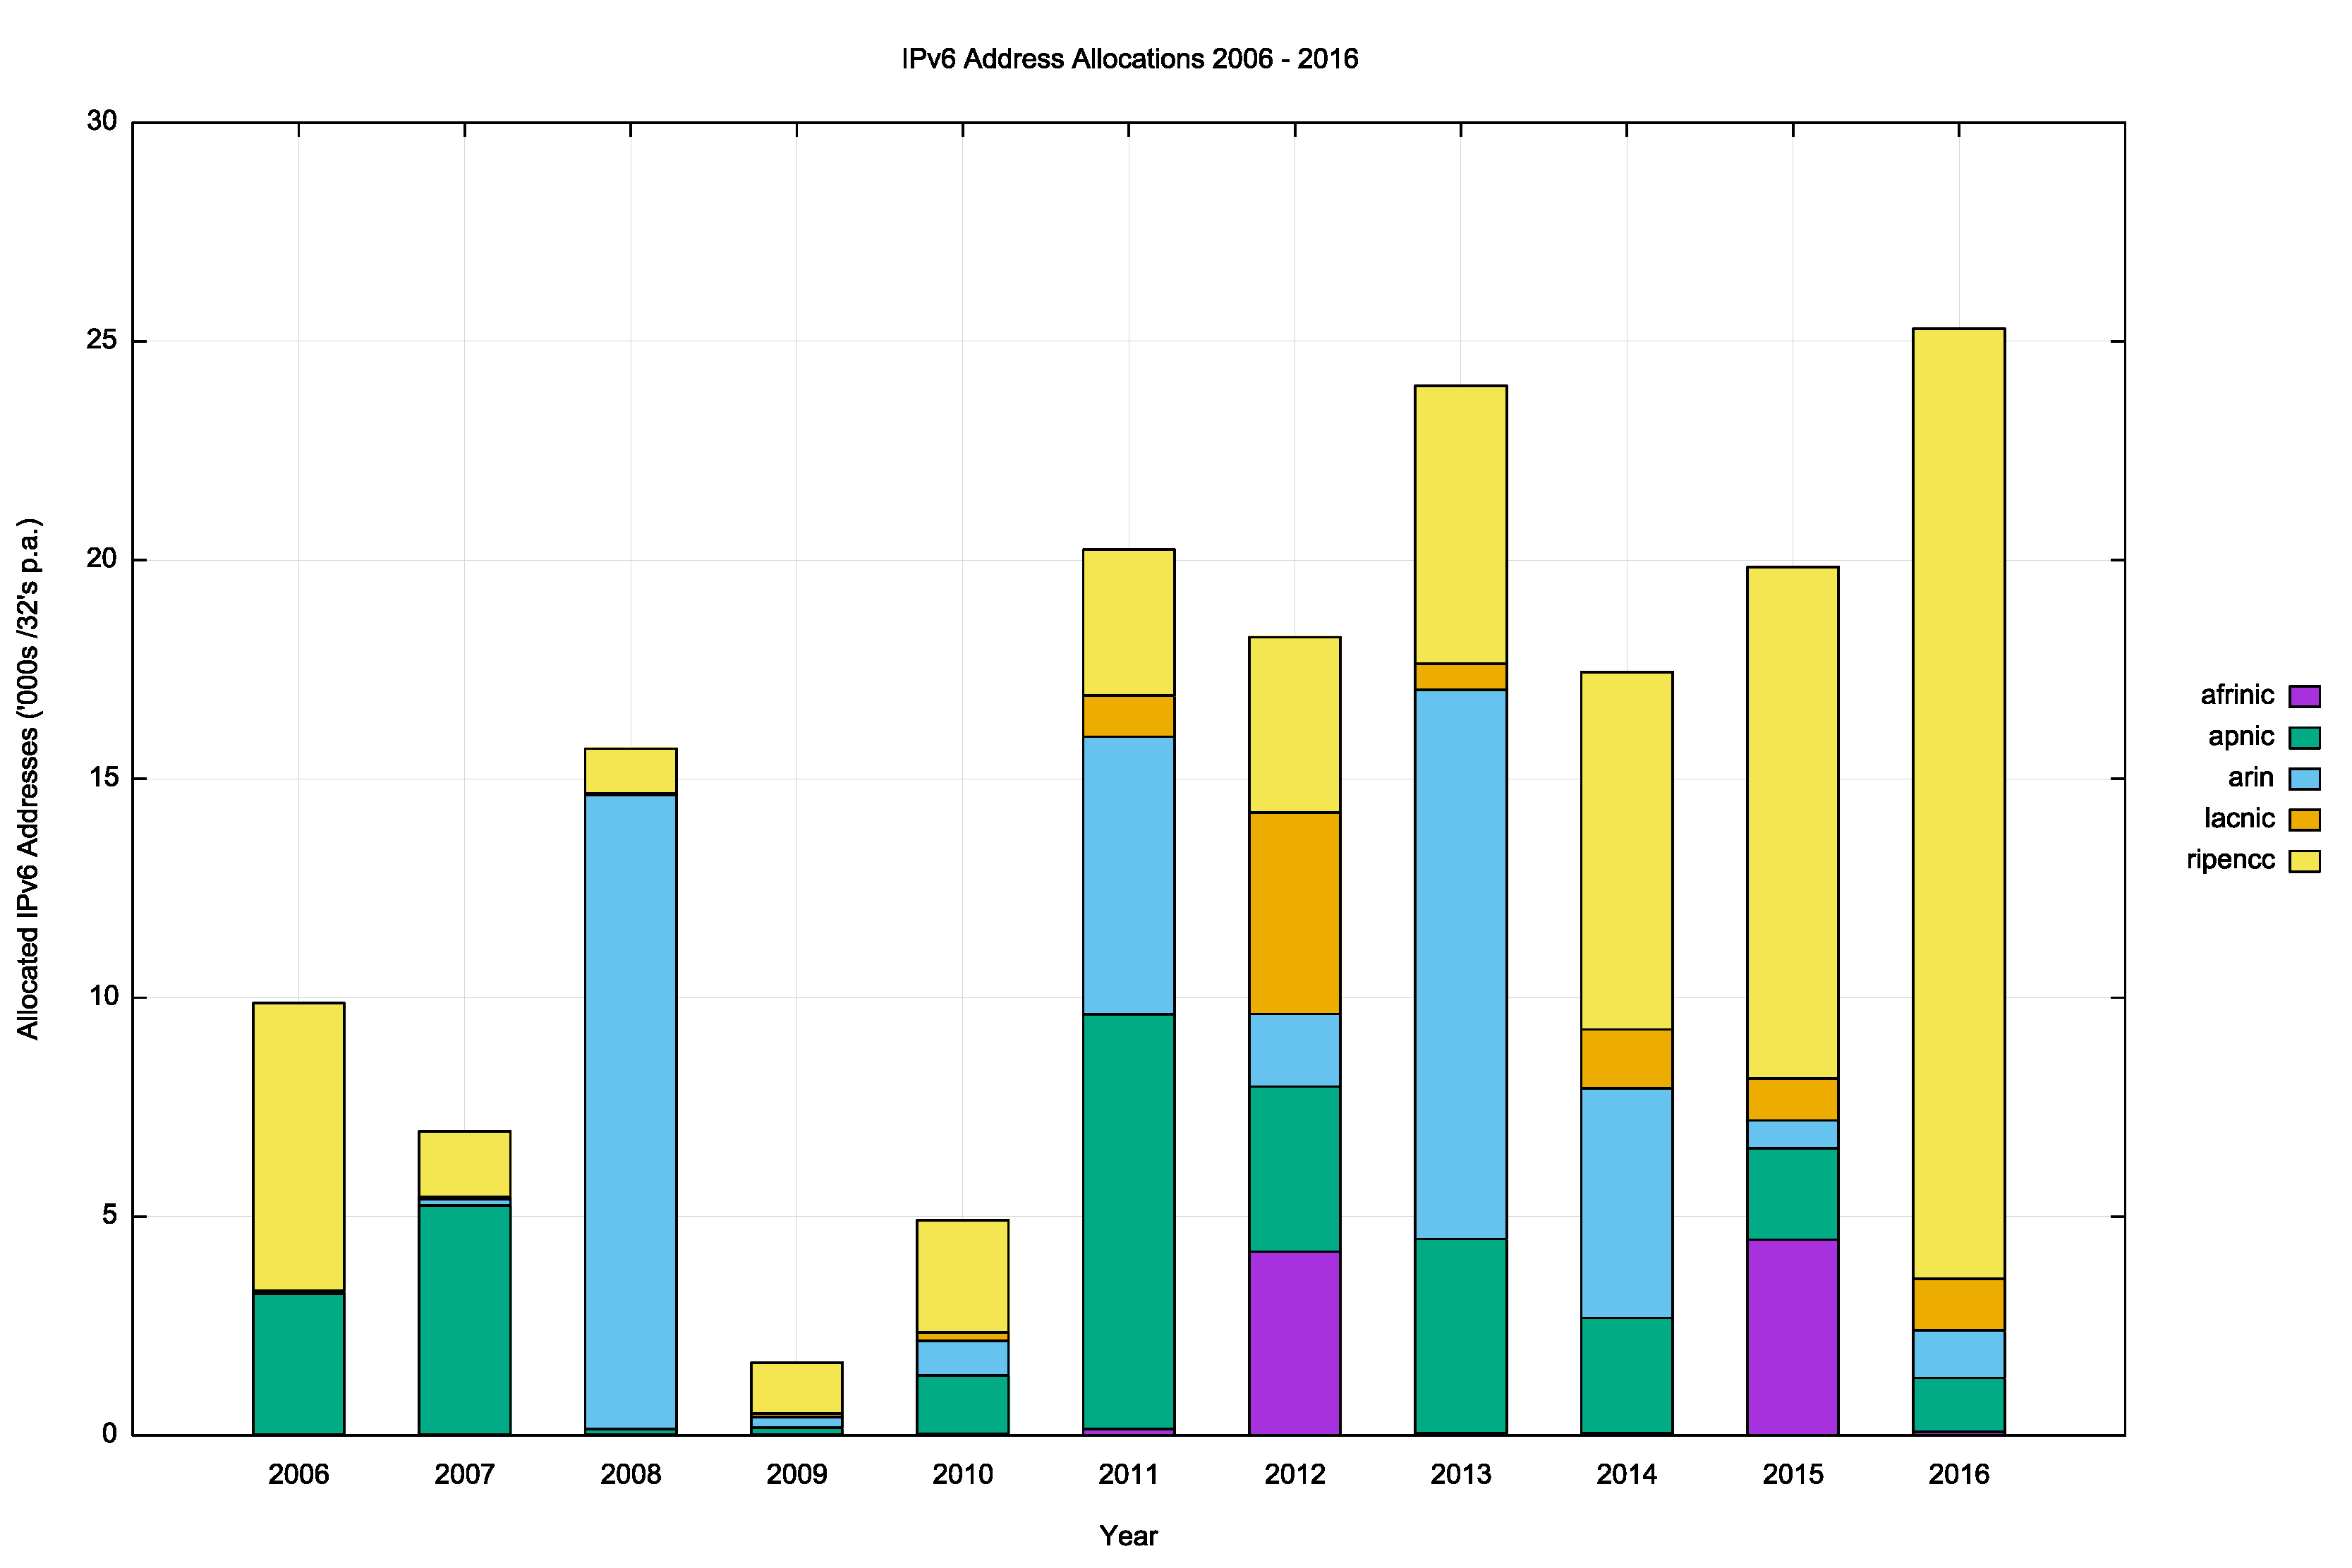 Figure 11 – Volume of IPv6 Allocations per year
Table 16 shows the countries who received the largest number of IPv6 allocations, while Table 17 shows the amount of IPv6 address space assigned on a per economy basis for the past 5 years (using units of /32s).
| Rank | 2012 | 2013 | 2014 | 2015 | 2016 | ||||||
|---|---|---|---|---|---|---|---|---|---|---|---|
| 1 | USA | 549 | USA | 485 | Brazil | 946 | Brazil | 815 | Brazil | 744 | |
| 2 | UK | 199 | Brazil | 473 | USA | 457 | USA | 540 | USA | 603 | |
| 3 | Germany | 187 | UK | 248 | UK | 239 | China | 267 | China | 509 | |
| 4 | Russia | 186 | Russia | 246 | Germany | 215 | Germany | 249 | Germany | 266 | |
| 5 | Netherlands | 124 | Germany | 195 | Russia | 201 | UK | 216 | Australia | 219 | |
| 6 | Australia | 113 | Netherlands | 134 | Netherlands | 181 | Russia | 183 | UK | 211 | |
| 7 | France | 111 | France | 132 | France | 122 | Netherlands | 170 | Netherlands | 198 | |
| 8 | Sweden | 90 | Sweden | 112 | Switzerland | 103 | Australia | 123 | Russia | 173 | |
| 9 | Argentina | 78 | Australia | 102 | Italy | 103 | Spain | 119 | India | 161 | |
| 10 | Poland | 77 | Italy | 98 | Australia | 101 | France | 116 | Indonesia | 159 |
Table 16 – IPv6 allocations by economy
| Rank | 2012 | 2013 | 2014 | 2015 | 2016 | ||||||
|---|---|---|---|---|---|---|---|---|---|---|---|
| 1 | Argentina | 4,177 | USA | 12,537 | USA | 4,930 | South Africa | 4,440 | UK | 9,571 | |
| 2 | Egypt | 4,098 | China | 4,135 | China | 2,127 | China | 1,797 | Germany | 1,525 | |
| 3 | China | 3,136 | UK | 782 | UK | 1,090 | UK | 1,297 | Netherlands | 1,312 | |
| 4 | USA | 1,337 | Germany | 651 | Brazil | 863 | Germany | 1,269 | USA | 1,137 | |
| 5 | Italy | 635 | Russia | 523 | Germany | 749 | Netherlands | 1,010 | Russia | 1,005 | |
| 6 | Russia | 403 | Netherlands | 463 | Netherlands | 719 | Russia | 864 | France | 926 | |
| 7 | Germany | 399 | Brazil | 450 | Russia | 716 | Brazil | 755 | Brazil | 727 | |
| 8 | UK | 356 | France | 435 | France | 436 | Spain | 708 | Spain | 702 | |
| 9 | Canada | 323 | Italy | 339 | Italy | 410 | Italy | 707 | Italy | 679 | |
| 10 | Brazil | 294 | Switzerland | 265 | Switzerland | 369 | USA | 662 | China | 596 |
Table 17 – IPv6 address allocation volumes by economy (/32s)
Four of the countries in Table 17 listed as having received the highest volumes of allocated addresses in 2016, Russia, Spain, Italy and China, all have IPv6 deployments that are under 2% of their total user population. To what extent are allocated IPv6 addresses visible as advertised prefixes in the Internet’s routing table?
Figure 12 shows the overall counts of advertised, unadvertised and total allocated address volume for IPv6 since mid-2009. Aside from the obvious discontinuity in early 2013, when a registration of a single /18 national address allocation of Brazil of a /18 was replaced by the actual end user allocations, it is clear that the pool of allocated but unadvertised IPv6 addresses far exceeds the total sum of allocated addresses.
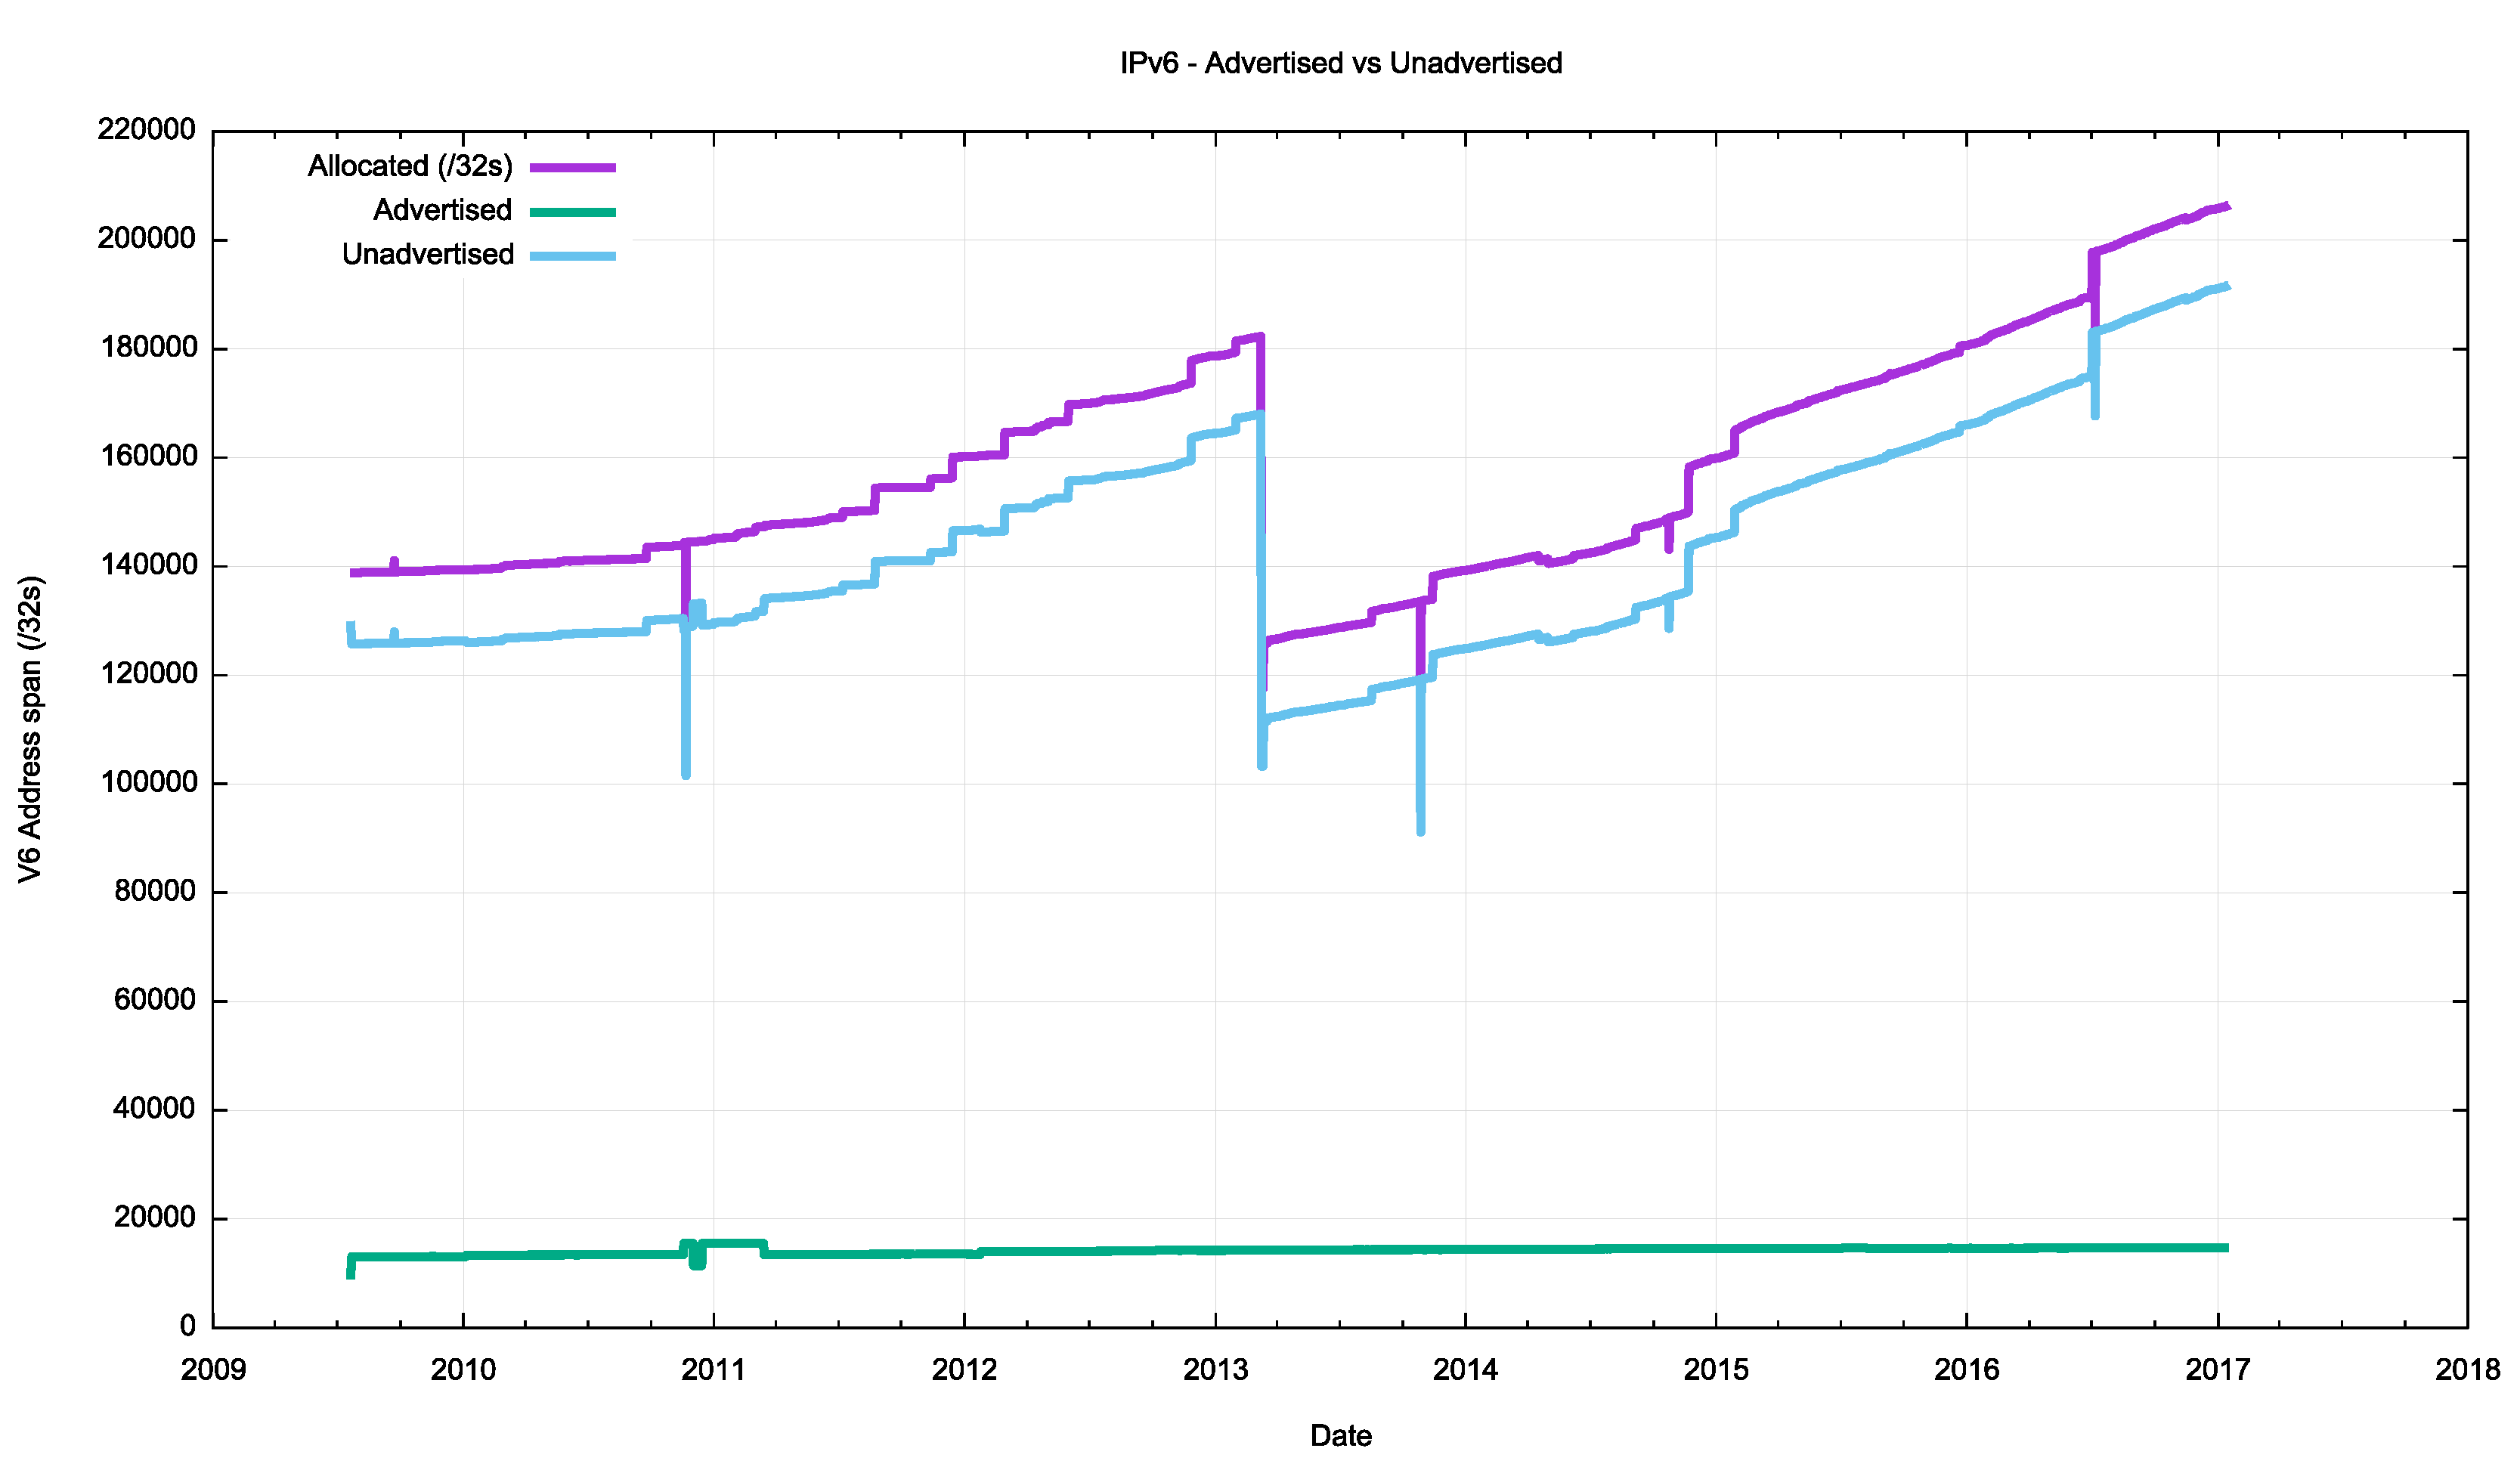
Figure 12 – Allocated, Unadvertised and Advertised IPv6 addresses
It is probably clearer to see the ratio of advertised to unadvertised addresses expressed as a percent, as shown in Figure 13. By the end of 2016 less than 8% of the total pool of allocated IPv6 addresses was advertised in BGP, while slightly more than 92% of these addresses were unadvertised.
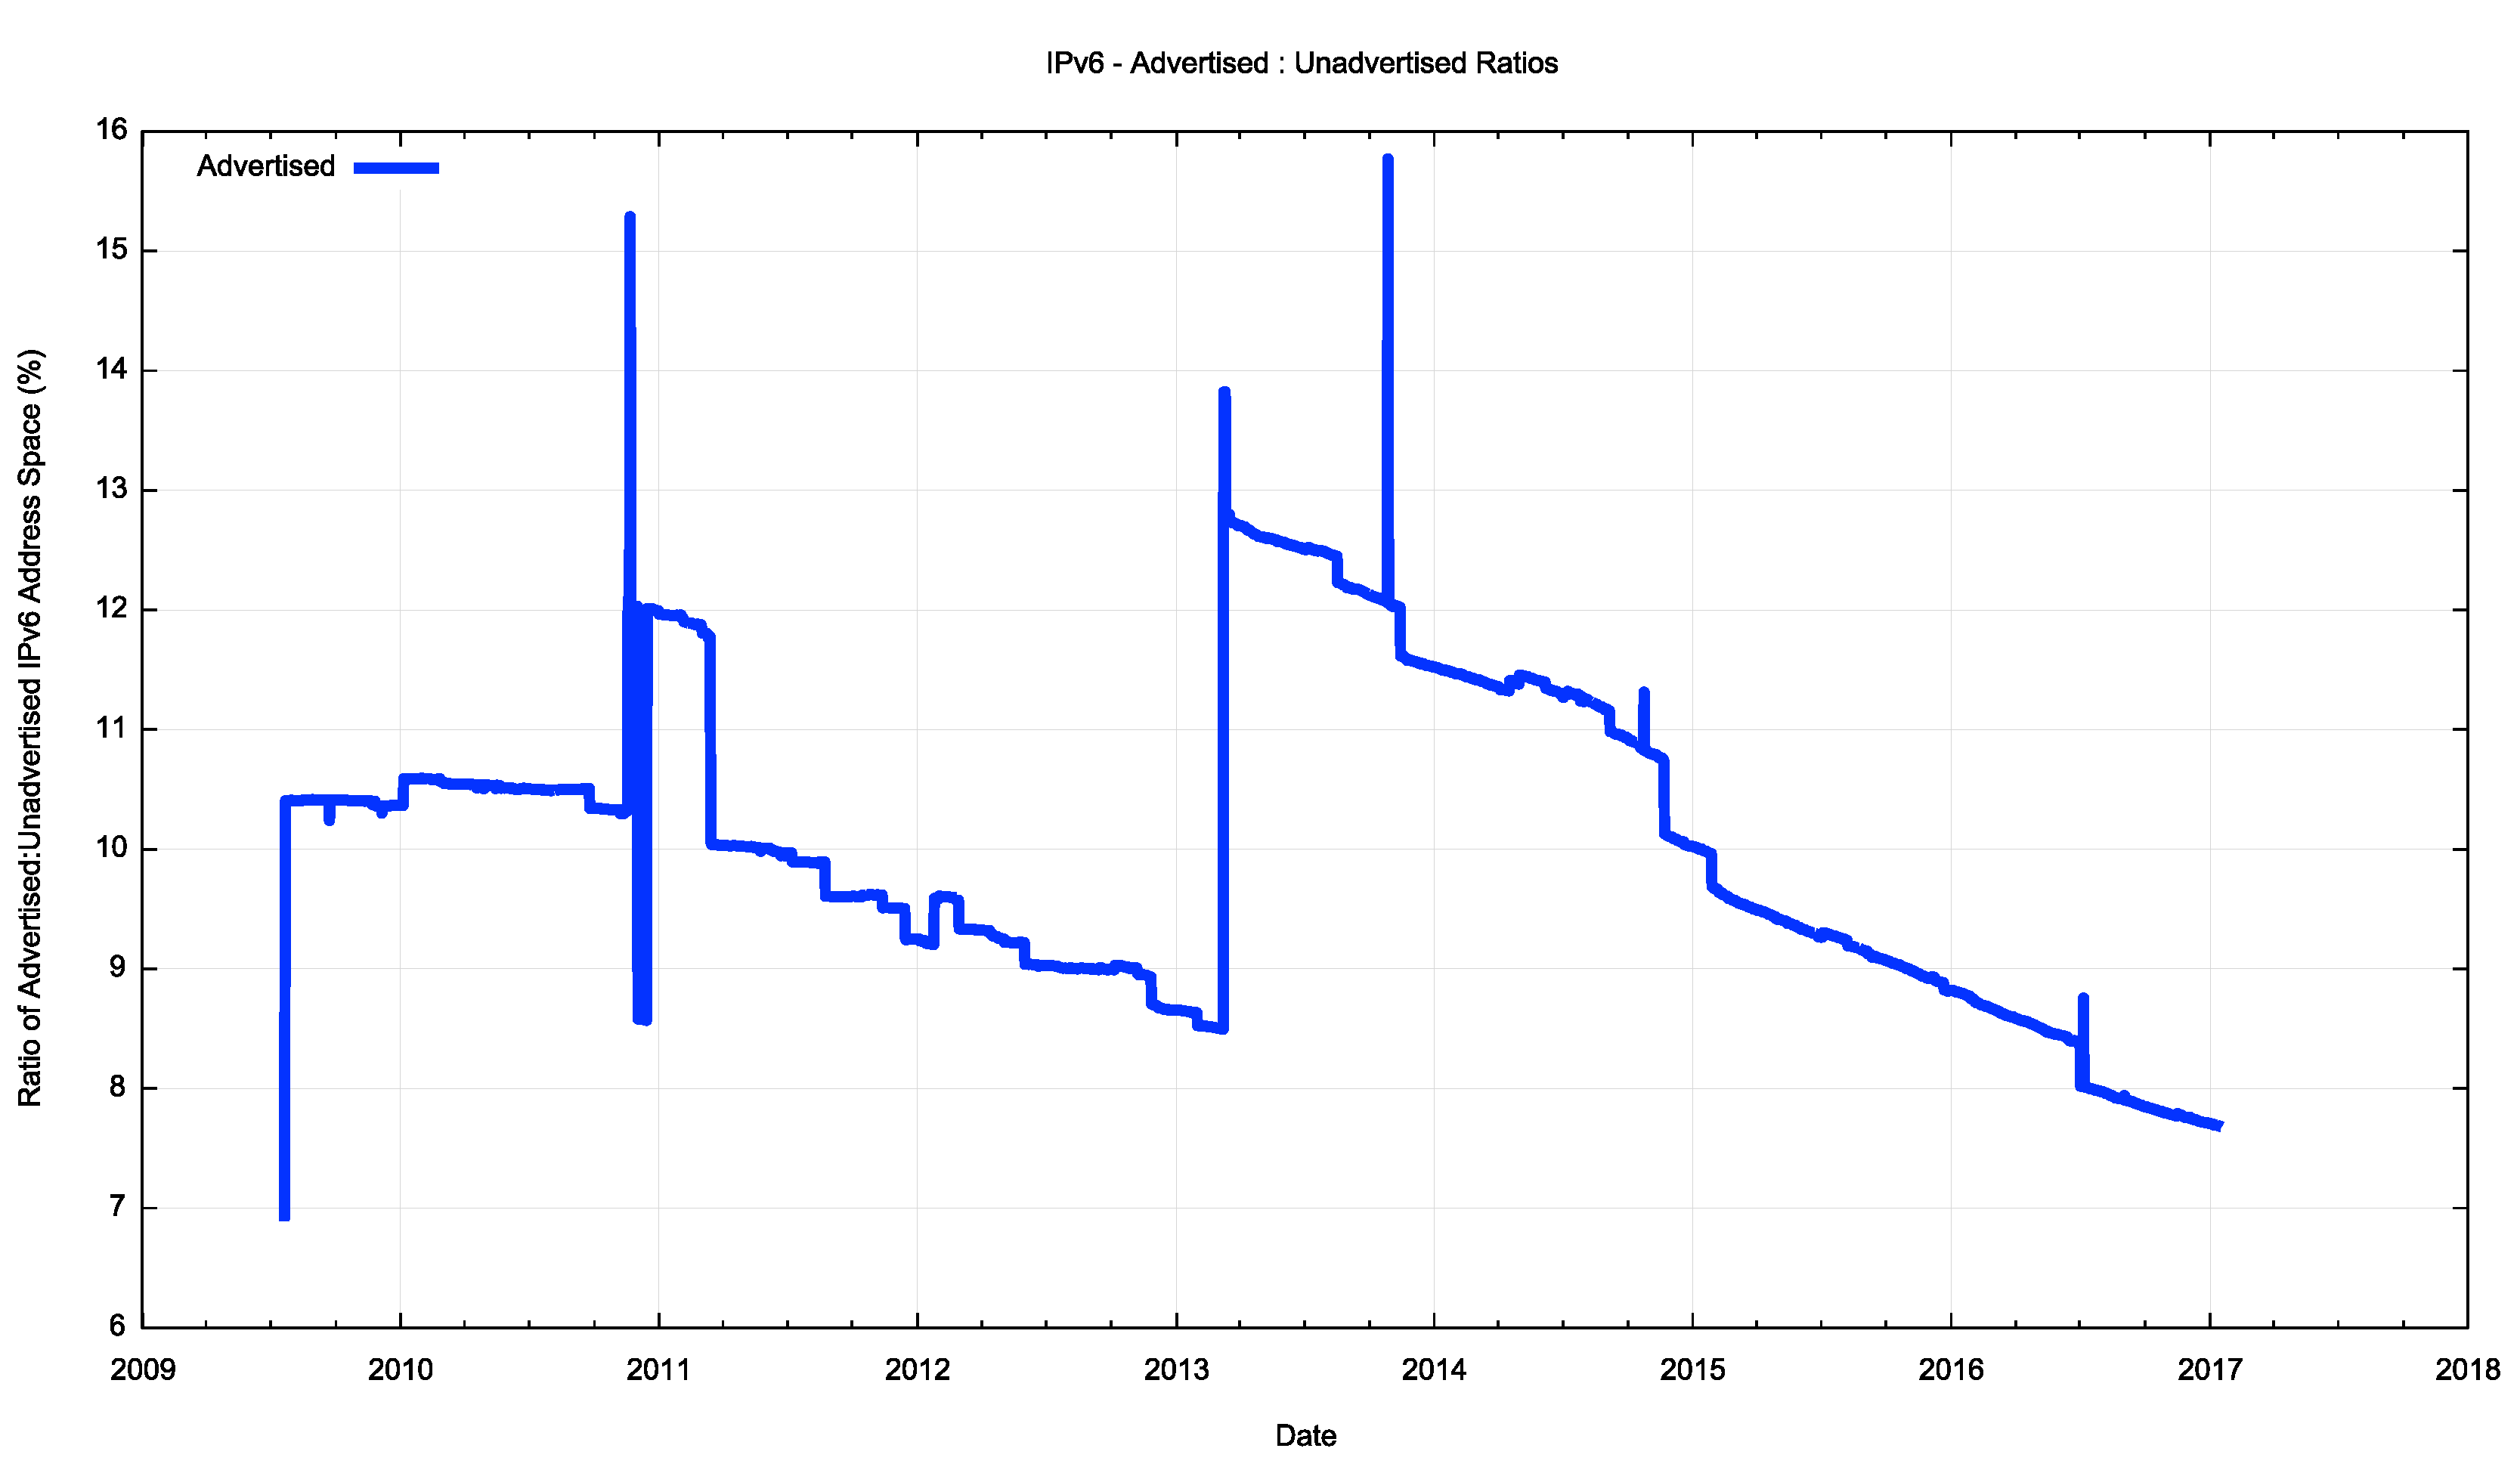
Figure 13 – Advertised IPv6 addresses as a percentage of the Allocated Address Pool
Every economy is different in this respect, and Table 18 shows the same ratio of advertised addresses to the total pool of addresses allocated to entities in each of the 25 economies holding the largest allocated IPv6 address pools. The table also shows the current estimated level of usage of IPv6 in that economy.
| Rank | CC | Allocated /32s | Advertised /32s | Ratio | IPv6 Use | Economy |
|---|---|---|---|---|---|---|
| 1 | US | 43,030 | 138 | 0.3% | 32.9% | USA |
| 2 | CN | 21,196 | 29 | 0.1% | 0.5% | China |
| 3 | GB | 17,139 | 2,148 | 12.5% | 25.5% | UK |
| 4 | DE | 16,107 | 226 | 1.4% | 44.0% | Germany |
| 5 | FR | 11,432 | 38 | 0.3% | 18.2% | France |
| 6 | JP | 9,415 | 93 | 1.0% | 19.7% | Japan |
| 7 | AU | 8,864 | 4,109 | 46.4% | 14.8% | Australia |
| 8 | IT | 7,143 | 50 | 0.7% | 22.2% | Italy |
| 9 | SE | 5,736 | 4,148 | 72.3% | 31.1% | Sweden |
| 10 | KR | 5,251 | 29 | 0.6% | 8.8% | Rep. Korea |
| 11 | NL | 4,939 | 600 | 12.1% | 76.6% | Netherlands |
| 12 | AR | 4,793 | 4 | 0.1% | 10.5% | Argentina |
| 13 | ZA | 4,640 | 9 | 0.2% | 8.0% | Sth Africa |
| 14 | EG | 4,105 | 4 | 0.1% | 41.0% | Egypt |
| 15 | RU | 3,954 | 6 | 0.2% | 23.2% | Russia |
| 16 | PL | 3,740 | 31 | 0.8% | 35.5% | Poland |
| 17 | BR | 3,651 | 19 | 0.5% | 13.2% | Brazil |
| 18 | ES | 2,800 | 9 | 0.3% | 9.5% | Spain |
| 19 | TW | 2,359 | 2,159 | 91.5% | 1.7% | Taiwan |
| 20 | CH | 2,090 | 111 | 5.3% | 31.0% | Switzerland |
| 21 | NO | 1,618 | 286 | 17.7% | 14.5% | Norway |
| 22 | IR | 1,491 | 3 | 0.2% | 4.0% | Iran |
| 23 | TR | 1,326 | 1 | 0.1% | 49.0% | Turkey |
| 24 | CZ | 1,319 | 41 | 3.1% | 11.3% | Czech Rep. |
| 25 | UA | 1,082 | 1 | 0.1% | 4.0% | Ukraine |
Table 18 – IPv6 Address Allocation volumes and Advertised Address Count by economy (/32s)
There is a considerable variation in these numbers. Taiwan advertises the majority of its allocated IPv6 addresses, yet the extent of IPv6 deployment is still quite low. On the other hand, the United States advertises only 0.3% of its allocated address pool, yet has an IPv6 deployment level spanning one-third of its user population.
What these figures point to is that registries and service operators do not feel as constrained with their address management practices with IPv6, and are willing to operate with very low address utilization efficiencies in IPv6. This is perhaps an instance where one of the original design objectives of IPv6 is evident, in that IPv6 was intended to provide such a large address space that it was no longer necessary to pay the price of operating extremely conservative address management practices. In that respect, IPv6 appears to have succeeded!
The Outlook for the Internet
Once more, the set of uncertainties that surround the immediate future of the Internet is considerably greater than what we can be reasonably certain about.
There has been much in the way of progress in the transition to IPv6 in 2016, but that does not necessarily mean that other providers will follow the lead. We do not appear to think that the collective costs of NAT deployment are unsupportable, and there would appear to be a school of thought that says that NATs could cost effectively absorb some further years of Internet device population growth. At least that’s the only rationale I can ascribe to a very large number of service providers who are making no visible moves to push out dual stack services. Given that the objective of this transition is not to turn on dual stack everywhere, but to turn off IPv4, there is still some time to go, and the uncertainty lies in trying to quantify what that time might be.
The past few years period has been dominated by the mass marketing of mobile Internet services, and the growth rates for 2014 through to 2016 perhaps might have been the highest so far recorded, were it not for the exhaustion of the IPv4 address pool. In address terms, this growth in the IPv4 Internet is being almost completely masked by the use of CGNs in the mobile service provider environment, so that the resultant demands for public addresses in IPv4 are quite low and the real underlying growth rates in the network are occluded by these NATs.
In theory, there is no such requirement for IPv6 to use NATs, and if the mobile world were deploying dual stack ubiquitously then this would be evident in the IPv6 address allocation data. Unfortunately, no such very large, broad scale of deployment of IPv6 was visible in the address statistics for 2016. This points to a mobile Internet whose continued growth in 2016 remains, for the most part, highly reliant on NATs, and this, in turn, points to some longer term elements of concern for the continued ability of the Internet to support further innovation and diversification in its portfolio of applications and services.
We should also be seeing address demands for deployments of large scale sensor networks and other forms of deployments that are encompassed under the broad umbrella of the Internet of Things. This does not necessarily imply that the deployment is merely a product of an over-hyped industry, although that is always a possibility. It is more likely to assume that such deployments take place using private IPv4 (or IPv6 ULA) addresses, and once more rely on NATs or application level gateways to interface to the public network. Time and time again we are lectured that NATs are not a good security device, but in practice NATs do offer a reasonable front line defence against network scanning malware, so there may be a larger story behind the use of NATs and device-based networks than just a simple conservative preference to continue to use an IPv4 protocol stack.
We are witnessing an industry that is no longer using technical innovation, openness and diversification as its primary means of propulsion. The widespread use of NATs in IPv4 limit the technical substrate of the Internet to a very restricted model of simple, client/server interactions using TCP and UDP. The use of NATs force the interactions into client-initiated transactions, and the model of an open network with considerable flexibility in the way in which communications take place is no longer being sustained in today’s network. Incumbents are entrenching their position and innovation and entrepreneurialism is taking a back seat while we sit out this protracted IPv4/IPv6 transition.
What is happening is that today’s Internet carriage service is provided by a smaller number of very large players, each of whom appear to be assuming a very strong position within their respective markets. The drivers for such larger players tend towards risk aversion, conservatism and increased levels of control across their scope of operation. The same trends of market aggregation are now appearing in content provision, where a small number of content providers are exerting a dominant position across the entire Internet.
The evolving makeup of the Internet industry has quite profound implications in terms of network neutrality, the separation of functions of carriage and service provision, investment profiles and expectations of risk and returns on infrastructure investments, and on the openness of the Internet itself. The focus now is turning to the regulatory agenda. Given the economies of volume in this industry, it was always going to be challenging to sustain an efficient, fully open and competitive industry, but the degree of challenge in this agenda is multiplied many-fold when the underlying platform has run out of the basic currency of IP addresses. The pressures on the larger players within these markets to leverage their incumbency into overarching control gains traction when the stream of new entrants with competitive offerings dries up. And, the solutions in such scenarios typically involve some form of public sector intervention directed to restore effective competition and revive the impetus for more efficient and effective offerings in the market.
As the Internet continues to evolve, it is no longer the technically innovative challenger pitted against venerable incumbents in the forms of the traditional industries of telephony, print newspapers, television entertainment and social interaction. The Internet is now the established norm. The days when the Internet was touted as a poster child of disruption in a deregulated space are long since over, and these days we appear to be increasingly looking further afield for a regulatory and governance framework that can continue to challenge the increasing complacency of the newly-established incumbents.
It is unclear how successful we will be in this search. We can but wait and see.
This article has originally been published on the APNIC blog.


Comments 0
The comments section is closed for articles published more than a year ago. If you'd like to inform us of any issues, please contact us.