The goal of this article is to introduce a methodological basis for a geopolitical analysis of the Internet and to illustrate the geopolitics of cyberspace. For this purpose, we used the BGP feeds provided by the RIPE Routing Information Service to regularly infer AS-level connectivity graphs. We have analysed the evolution of these graphs over a long period (several years) and witnessed how the structure of connectivity changes with geopolitical changes. We present a set of “algorithmic maps” that we created to represent a number of issues defined below.
One can understand the geography of the Internet and the datasphere through three approaches: the datasphere as embedded in the geographic space, the geographic space as embedded in the datasphere, and Internet as a new space on its own. Representing the “hardware”, i.e. physical equipment and cable infrastructures, data centres, exchange points, in a geographical space enables discussion about Internet issues such as:
a) A classical geographical and geopolitical problems, in terms of territory planning and spatial inequalities;
b) A framework that leverages the cyberspace and data can be gathered over the Internet to generate information that is useful to understand concrete geographical and geopolitical interaction in the real world, making Internet measurements a new observation tool for monitoring the world’s evolution;
c) A framework that represents cyberspace as a space that is independent of geography where existing relationships generate complex topology and structures.
BGP RIPE feeds as graphs
We use BGPstream to get BGP updates from several open BGP feeds (RIPE RIS and Route Views). When an AS path is announced, with two consecutive AS1 and AS2, we can infer that there is a direct link between AS1 and AS2. Therefore, by looking at the flow of announced paths coming from neighbouring ASes one can infer an AS-level graph connecting ASes that have appeared at least on one of the announced AS paths (see On Inferring Autonomous System Relationships in the Internet by Lixin Gao). We leverage this approach to create for each minute a snapshot of the AS-level graph. For this purpose, we combine several BGP feeds coming from several BGP collectors. As announcements are made at a prefix level, we can assign to each link in the AS-level graph a count attribute that measures the number of IP addresses that can be reached through paths going through the link. We moreover assign to each vertex in the graph some attributes including the number of prefixes issued at the AS represented by the node, and the last time there was an update or an announcement relative to that AS.
The AS graphs generated by this approach are known to be incomplete [Cheno]. In particular, BGP path filtering policies do not expose less preferred paths that would be chosen if the preferred announced path were not available. Moreover, traffic engineering and load balancing can further blur the real AS graph (see The Internet Topology Zoo by S. Knight et.al). This incompleteness adds a dimension to the challenge one is confronted when analysing BGP graphs. Using the Whois registry, we can append the name and country of each AS to the inferred graph, this yields the following JSON file:
–collector': 'rrc19', 'message': 'announce', 'peer': {'address': '197.157.79.173', 'asn': 37271}, 'time': 1515110408, 'fields': {'asPath': ['37271', '6939', '52320', '23106', '23106', '23106', '262700'], 'prefix': '187.102.120.0/21', 'nextHop': '197.157.79.173, 'flags': {'version': 'v4', 'shortPath': ['37271', '6939', '52320', '23106', '262700'], 'geoPath': ['ZA', 'US', 'CO', 'BR', 'BR'], 'names': ['WorkonlineCommunications(Pty) Ltd', 'Hurricane Electric, Inc.', 'GlobeNetCabosSubmarinosColombia, S.A.S.', 'CemigTelecomunicaçõesSA', 'EfibraTelecomLTDA - EPP'],’},
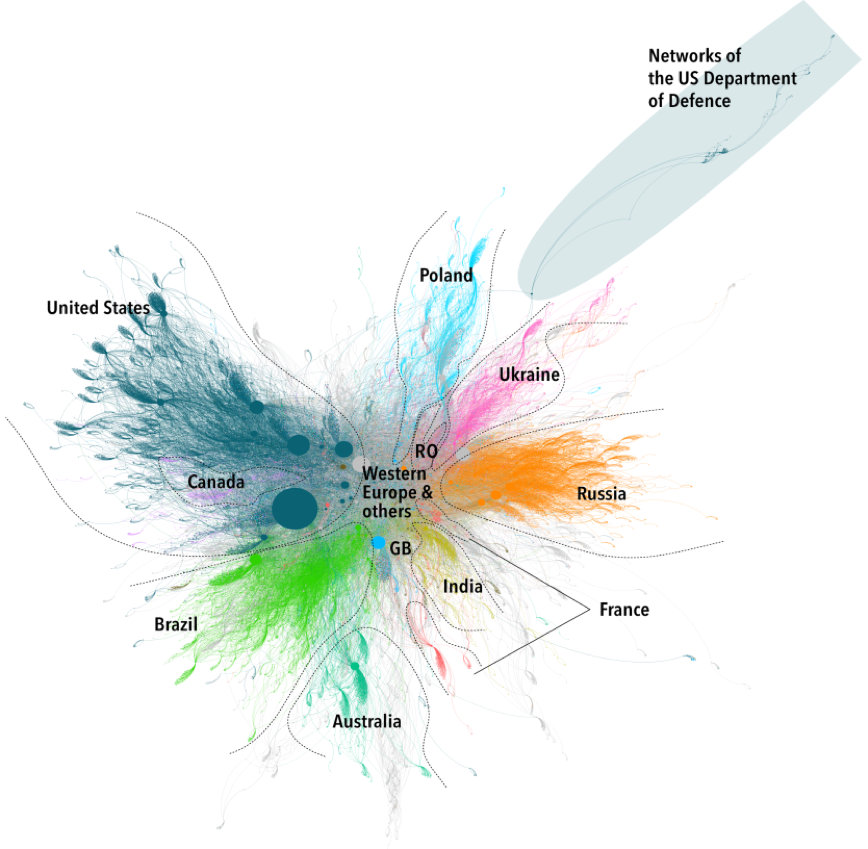
Figure 1 below shows a view of the full AS graph at a fixed time (May 2018), we scale the size of the nodes with respect to their betweenness centrality, which is a metric that quantifies how essential a node is to the overall connectivity. We witness already the underlying complexity associated with BGP.

Figure 1: The full AS graph as observed in 2018
We notice that a geographic description of the graph naturally arises. We represent sets of countries by specific colours as illustrated in Figure 1. We observe preliminarily that:
- The Russian network and the US network are diametrically opposed to each other;
- Western Europe is central to this graph and plays the role of intermediary between the different regions of the world;
- Brazil, Russia, Ukraine and Poland seem to be overly represented in the AS-level graph;
- Australia is very disconnected from the core of the Internet, which is related to how isolated it is geographically to the rest of the world;
- The network of the US Department of Defence is very far away from the rest of the Internet which illustrates the will of the US government to secure the sensitive side of its network;
- China’s network is almost non-visible, due to the policy of Internet isolation and the few Autonomous Systems that connect the Chinese population to the rest of the world;
- We seem to discern many zones of influences but at this stage, we cannot say for sure under which auspices each country lies in. However, the notion of influence remains ill-defined and in the next section, we develop a methodology which defines and interprets more rigorously the concept of influence in connectivity.
Representation
The notion of influence is difficult to formalise as it covers a wide variety of aspects:
- Influence can act on the contents and take the form of an ability to shape the preferences of an Internet user through appeal and attraction to contents aligned with the aim and objectives of a specific country.
- Influence can also be understood in terms of power. In his book Peace and War: A Theory of International Relations (Garden City, N.Y., Doubleday, 1966), Raymond Aaron defines power as the ability of a political unit to impose its wills to other units. In this case, it can be defined as the potential capacity of a country to act on the connectivity of another country to the global Internet. This yields into a quantifiable definition of influence as it looks at how dependent one country is to another for its access to the core of the Internet constituted of the Tier 1 ASes.
- One can also define influence by measuring the closeness of a national network to another foreign network. With this definition, the influence is evaluated through computing a distance defined within a spatial embedding representing graph nodes’ as a point in a d-dimensional metric space.
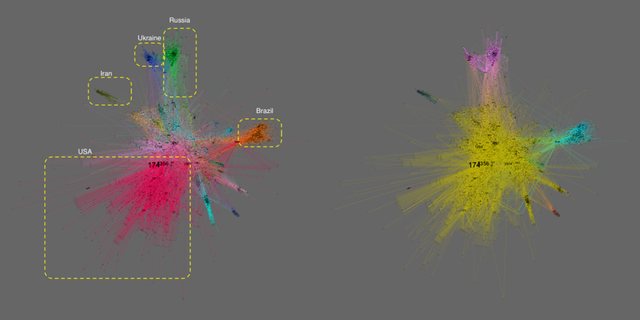
While the first two notions are more difficult to characterise, the third option happens to be more tractable. For this purpose, we construct a spectral embedding of the AS-level graph. The intuition behind the spectral embedding is to combine nodes that have a similar neighbourhood into separate groups. In more formal terms we want to find a partition of the graph where the nodes inside a cluster are heavily connected to each other while nodes in different clusters are less connected. We return to the excellent article A Tutorial on Spectral Clustering written by Von Luxemburg for a more detailed introduction to the notion of spectral embedding. Applying the prior methodology results to the following partition of the AS-level graph:

The above figure gives some interesting insights and patterns:
- We see on the right-side graph that the wide majority of the nodes belong to a bright yellow coloured cluster that contains the USA and Western Europe ASes. This show the strong integration of the Internet in these countries that are indistinguishable from each other. While some other countries are observing different neighbourhoods.
- We observe that Iran and Brazil are two isolated islands of connectivity within the AS-level graph. We have confirmed this tendency in more fine-grained settings in our previous work.
- Russia and Ukraine belong to the same cluster. Our approach provides a new understanding of the mutual interactions between those two major actors. We have also followed through a more detailed analysis of the evolution of a part of the Ukrainian BGP landscape towards Europe while conflicted territories (Crimea, Donbass) are drifting toward Russian actors.
Conclusion
This article provides an initial view of the emerging research fields of the geopolitics of the datasphere and of “cyber-cartography”. A major challenge in this new field is the multidisciplinary nature of it, that requires the close interaction between several communities that are not generally working together: geographers, strategists, Internet measurement professionals, network providers etc. A major goal of providing this article to the RIPE community is also to foster the development of such multidisciplinary research between the RIPE and academic communities along with the other stakeholders.
Louis is a RACI fellow and presented this research at MENOG 19 (slides, video).


Comments 0
The comments section is closed for articles published more than a year ago. If you'd like to inform us of any issues, please contact us.