
LatencyMON is a new RIPE Atlas web application that you can use to easily visualise and compare multiple latency trends collected by groups of RIPE Atlas probes.
Introduction
One of the most common uses of RIPE Atlas is monitoring latencies to a target machine from many vantage points located all over the world. Usually the analysis of latencies requires plotting and comparing charts, where each chart is a group of vantage points that have something in common, such as being located in the same country or in the same Autonomous System.
We are happy to announce a brand new tool in the RIPE Atlas tool set that will help you with this task.
LatencyMON is an interactive tool designed to easily visualise and compare multiple latency trends collected by groups of RIPE Atlas probes.
LatencyMON allows you to group arbitrary sets of probes and merge and compare different measurements - even measurements to different targets. It uses the RIPE Atlas streaming system to update the charts in real time.
We designed the tool based on a number of use cases indicated by RIPE Atlas users:
- Performance comparisons to reach a service or website from different countries or providers
- Measuring the spread of a network outage
- Measuring and comparing CDN or DNS resolution in multiple geographic areas
- Re-using already created measurements - even for measurement types other than ping - to get information about latencies
- Comparing multiple ISPs or hosting providers at the same time, from vantage points with characteristics similar to those at the user or customer end
- Creating views that are easily shareable and can be embedded in reports
Overview
Figure 1 below shows the main view of LatencyMON.
The widget is embedded by default In the detail page of all the supported measurements, but it can be embedded in any external HTML page.

The various trends are represented by means of stacked charts, each chart representing a single RIPE Atlas probe or group of probes. By default, each chart will show Min, Med, and Max values of the collected latencies with three coloured lines. Each dot represents the exact time a sample was retrieved, and a filled dot means the original value was an outlier falling outside the y-axis domain.
One of the main features of LatencyMON is the auto-tuning algorithm used to optimise the visualisation of multiple trends, often with big variations, on a common axis. This feature improves the readability of the entire scene without requiring the user to manually tune user interface controllers.
By hovering over a node, you can get all the information available about that sample, including the raw data.
When no data has been collected, an empty spot in one or more charts will appear. The red dashed lines represent the positions of the samples affected by packet loss. A protracted 100% packet loss will appear as a red dashed area.
Main Features
Latencymon allows multiple ping, traceroute, DNS, SSL and HTTP(S) measurements to be loaded at the same time.
All the probes involved in the loaded measurements appear in a list, as shown in Figure 3 below.

Figure 3: List of probes for loaded measurements
Grouping Probes
The user can filter probes by different attributes and select a set of probes to be displayed individually or as a group. The grouping aggregates samples coming from different probes, allowing for a drastic reduction of the number of line charts displayed. The charts can be dragged to change their order, deleted or expanded. When a measurement is loaded at initialisation, an algorithm will automatically try to guess what the best grouping is for the measurement. For example, if multiple probes in multiple countries are available, a groping by country will be selected by default. If instead multiple targets are involved, a grouping by target is performed. On the right of each chart, information about the element in the group is shown.
Navigating in Time
While a particular time frame for the measurement is represented, the time bar underneath the graph can be used to easily navigate throughout the measurement's lifetime. The selected time window can be expanded or reduced accordingly via the time bar or the controls on the top right of the window. It is also possible to zoom in or out by selecting a portion of a chart.
Real-time Monitoring
When the selected time frame is recent enough, the streaming feature will be activated and the current scene will be updated with the new samples coming in real time from the probes . An indicator on the bar on top marks the streaming status while the new samples appear from the left. The axis may vary during the redraws since they are automatically calculated by the auto-tuning algorithm based on the samples available in the current time frame.
Permalink
The URL in the address bar of the browser is a permalink that can be used at any time to share the current scene.
Case Study: AMS-IX Outage
On 13 May 2015 at around 10:00 UTC, the Amsterdam Internet Exchange (AMS-IX) was involved in an outage that occurred during maintenance. As reported by the official source , an engineer accidentally placed a loop on the platform and the AMS-IX Internet traffic was partially paralysed.
The RIPE Atlas network has multiple anchors placed around the world. All the anchors are constantly measured by a subset of the 8,800+ probes in the RIPE Atlas network.
The effects of the outage are visible by selecting one of those measurements, such as the ping measurement
1402318
.
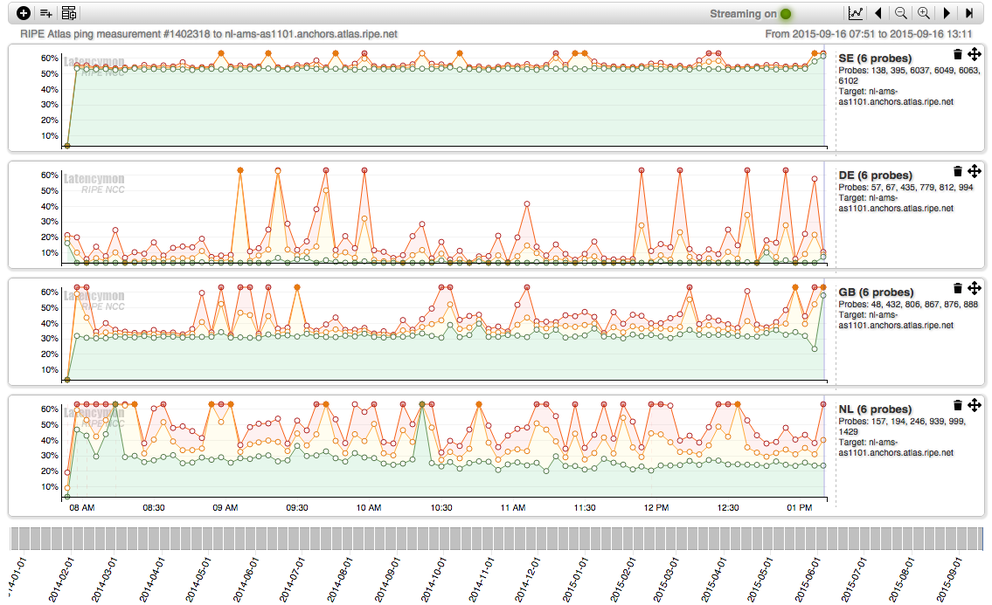
It involves the anchor nl-ams-as1101.anchors.atlas.ripe.net, located in Amsterdam. Figure 4 below shows the result of loading this measurement in LatencyMON.

Some of the probes are grouped by country. From 10:00 to 11:00 UTC, the various groups experienced 50% to 100% packet loss, depicted by the red areas. LatencyMON allowed us to see the effects of the outage on the rest of the world in real time, thanks to the streaming service.
See LatencyMON in action for the above example .
Upcoming Features
One of the most requested features was to be able to compare multiple trends in the same chart. Although this feature is not yet available in the beta version, it will soon become available via a comparison chart option while creating a group. In this case, the various probes involved in the group will be represented by a specific coloured line, as shown in the bottom chart in Figure 2 below.

Figure 2: Different chart types are available
We will further investigate smart-sorting features for automatic ordering of the charts based on performance parameters or similarity among the charts.
Source Code and Documentation
You can get the source code - and contribute - on GitHub.
If you just want to use the tool, you don't need the source code. LatencyMON can be embedded in any HTML page.
Please refer to the LatencyMON documentation for more details.
Feedback
We always want to hear what you think about the tools and services we offer. And we would especially like to hear about your own use cases for LatencyMON.
Here's how to get in touch:
- If you want to report a bug or problem: atlas [at] ripe [dot] net
- Please subscribe to the RIPE Atlas mailing list for discussions with active users and RIPE Atlas developers: ripe-atlas [at] ripe [dot] net
- For direct feedback: Contact Massimo Candela at mcandela [at] ripe [dot] net
Comments 10
The comments section is closed for articles published more than a year ago. If you'd like to inform us of any issues, please contact us.
Rob Turner •
I'd like to see a worked example of embedding this latencymon, I've tried and can't get it to work with one of my measurements. even looking at the source and duplicating the tool options doesn't seem to work for me.
Massimo Candela •
Hi Rob, You can use the embedding code described in the documentation https://atlas.ripe.net/docs/tools-latencymon/#embed I just checked now, it works. You just need to change the measurement ID. If you still have problems, or if the problem is only with one specific measurement ID, please contact me at mcandela [at] ripe [dot] net so we can solve it.
Michael Warburton •
I'm also having trouble getting embedding to work, it just doesn't display anything. I'll drop you an e-mail Massimo.
Massimo Candela •
Rob and Michael contacted me and we solved the issue! Thanks again for your emails!
Alessio Giorgetti •
Does this tool replace the old seismograph? I was better off with it
Massimo Candela •
Hello Alessio, Yes, it will replace the old Seismograph. LatencyMON includes all the features of Seismograph plus many new. If you think a feature is missing, please check the documentation or contact me at mcandela [at] ripe [dot] net.
Marc Sanchez •
I would like to know how should I write the tool options inside the code to get a connectivity in real time
Massimo Candela •
Hi Marc, As replied to your email: the real time function is supported by default. As soon as a new sample is collected by the RIPE Atlas system, you will get it in real time. To be sure about it, click on the “1h” option in a way to be in the most recent interval of time at native resolution (1h is going to be small enough). Anyway in the embedding code, you will find the option "syncWithRealTimeData" that can be set to true or false (default to true).
Frank Furthmüller •
I have a feature request: Implement two buttons to toggle the scale of the Y-Axis between "starting by the lowest value" (as it is now) or "starting by zero" and "ending by the highest value of that single graph" or "ending by the highest value of all graphs", please. This could help seeing geographical diversity in latency at a glance. Besides that: Great Work! *ThumbsUp
Massimo Candela •
Hello Frank, thanks for using LatencyMON! The min y (the 0 on the y-axis) is calculated based on ALL the charts, this removes from the y-axis the values which are the same for all the charts and leaves the different part intact. In fact, the Y-axis is always the same across all the charts. This serves exactly the purpose of allowing comparison at a glance!