
Oliver Gasser and his colleagues have been investigating the impact of COVID-19 on Internet traffic as seen from a variety of vantage points. Here's an overview of their findings.
The COVID-19 pandemic - one of the most serious medical crises since the 1918 flu pandemic - has dramatically changed many people's daily lives. The lockdown measures implemented in March 2020 in most countries forced their citizens to stay at home. As a consequence, millions of people were now working from home, educating themselves from home, and enjoying leisure time at home, which in turn changed Internet traffic.
Previous articles on RIPE Labs discussed how the RIPE NCC moved to remote working, the impact of the pandemic on Internet governance, changes in the Internet visible in the DNS, in RIPE RIS, in RIPE Atlas, and various other topics related to COVID-19.
In this article, we investigate the effect of the lockdown on various characteristics of Internet traffic across different vantage points.
Key points:
- Traffic increase of 15-20% within a week after the lockdown.
- Traffic patterns on workdays start to look more like weekends.
- Large growth in web conferencing, video, and gaming traffic.
Effects of real-world events on the Internet
In recent decades, studies analyzed the effects on Internet traffic of dramatic real-world events, such as the 9/11 attacks, earthquakes, severe weather conditions, and power outages. In this article, we highlight some of our findings of the COVID-19 pandemic's effect on Internet traffic.
Traffic volume changes
The first metric that we investigate is the traffic volume for different networks. In Figure 1 we show traffic changes from January 2020 until June 2020 for five different networks:
- An ISP located in Europe with more than 15 million fixed-line subscribers
- A mobile operator also located in Europe with more than 40 million customers
- Three Internet Exchange Points (IXPs) located in Central Europe, Southern Europe, and at the US East Coast

Figure 1: Traffic changes from January 2020 until June 2020 at multiple vantage points.
After the lockdown is implemented in March we see a traffic increase of 15-20% at the ISP as well as the three IXPs. Additionally, mobile traffic is slightly receding. Since millions of Internet users had to stay at home and use the Internet for work, education, and entertainment, we see an increase in ISP and IXP traffic. The decrease in mobile traffic can be explained by the fact that people did not go out that frequently and would therefore use their home Wi-Fi more often instead of their phone's mobile data plan.
Some of the lockdowns were lifted or relaxed around May 2020. As people were allowed to perform some of their daily habits outside of their home again, we see a decrease of the traffic at the IXPs and the ISP; instead mobile traffic is now growing again.
Our findings align with insights offered by two reports published by Google and reports from Comcast, Nokia, TeleGeography and two reports from Akamai.
Workday-weekend patterns
Next, we investigate differences in traffic patterns on workdays compared to weekends. Since most people are working on workdays and enjoying free time on weekends their online habits are vastly different on both types of days.
Figure 2 shows a traffic pattern at the Central European ISP for three days: February 19, February 22, and March 25.

Figure 2: Workday vs. weekend patterns before and after the lockdown.
As we can see in Figure 2, traffic at a pre-lockdown working day (blue bars) increases slowly over the day, exhibiting a mostly linear pattern between 5:00 in the morning and 18:00 in the evening. The traffic then reaches its peak at around 21:00. This aligns with the fact that most people are working from their office during the day and using the Internet from their home mostly during the evening hours.
On a weekend day (orange bars) the pattern looks different, with a much steeper increase during the morning hours and a slower growth during the day, again reaching the traffic peak at around 21:00 in the evening. Since more people are staying at home during the day on a weekend compared to a working day, this behavior is affecting the traffic pattern as well.
And finally, when we investigate the traffic pattern of a working day during lockdown (gray bars), we see that it much more resembles a weekend day than a working day before the pandemic. This nicely visualizes the effect of lockdown measures on Internet traffic patterns.
We now classify every day based on its traffic pattern to being more workday-like or weekend-like.

Figure 3: Traffic on workdays during lockdown look more like weekend traffic.
In Figure 3 we show the result of this classification. In the upper part of the graph we show days classified as weekend-like, in the lower part of the graph we show days exhibiting workday-like traffic patterns. Days which are classified correctly are shown in blue: workdays classified as workday-like and weekend days as weekend-like. Days which are classified incorrectly are colored in orange.
We see in the beginning of the year, that the classification based on traffic patterns works quite well, with the vast majority of days being classified correctly. After mid March, however, the majority of all days are classified as weekend-like, no matter if they are workdays or weekends, and we therefore see a lot of misclassified working days. As previously seen in Figure 2, people using the Internet from home during the day exhibits more of a weekend-like traffic pattern. Additionally, as can be seen by the increasing length of the bars starting around mid-March, we see an increase in the overall traffic per day. This increase, however, is not equally distributed over the whole day but is mostly happening in off-peak hours, which can be seen in Figure 2. The behavior of incorrect classifications starts to partially revert starting in mid May, when some countries lifted parts of the lockdown measures. Consequently, more days are now being classified correctly again.
Growth of specific classes of traffic
After having analyzed changes in traffic volumes and diurnal patterns, let's now look at specific classes of traffic. Since port-based classification mixes together a lot of traffic using common ports such as TCP/80 or TCP/443, we use a combination of port-based and AS-based classifications to classify the traffic at the ISP into different groups.

Figure 4: Change of traffic patterns for specific classes of traffic.
Figure 4 shows traffic changes comparing the months of March, April, and June to our base week of February. We group traffic into seven different traffic classes. Traffic changes are shown for each hour of the day for all days of the week. While it would go beyond the scope of this article to discuss each and every change that is visible in the figure, we will highlight the most interesting ones.
We see a strong increase in the traffic associated to web conferencing, video, and gaming traffic in March as a result of the increasing user demand for solutions like Zoom or Microsoft Teams. Also, as people spend more hours at home, they tend to watch videos or play games, thus increasing entertainment traffic demands. Interestingly, we also see a decrease in educational traffic in these vantage points.
In April and June, web conferencing traffic is still high compared to the pre-pandemic scenario, while we see a slight decrease in CDN and social media traffic. During these months many people are still working from home, but restrictions have been lifted or relaxed, which leads to an increase in in-person social activities and a decrease in online ones.
Educational network
In addition to the ISP, IXP, and mobile networks, we also anlazyed traffic changes in an educational network: REDImadrid connects 16 universities and research centers in the region of Madrid and serves nearly 290,000 users. We study the impact of the lockdown measures and we generally find a drop of up to 55% in traffic volume on working days during the pandemic. Similar to our findings for other networks, we also observe that working days and weekend days are becoming more similar in terms of total traffic. The hourly traffic patterns reveal a traffic increase between 9pm and 7am. This could be due to users working more frequently at unusual times, but also potentially caused by overseas students (mainly from Latin America and East Asia as suggested by the AS numbers from which these connections come from) who access university network resources from their home countries.

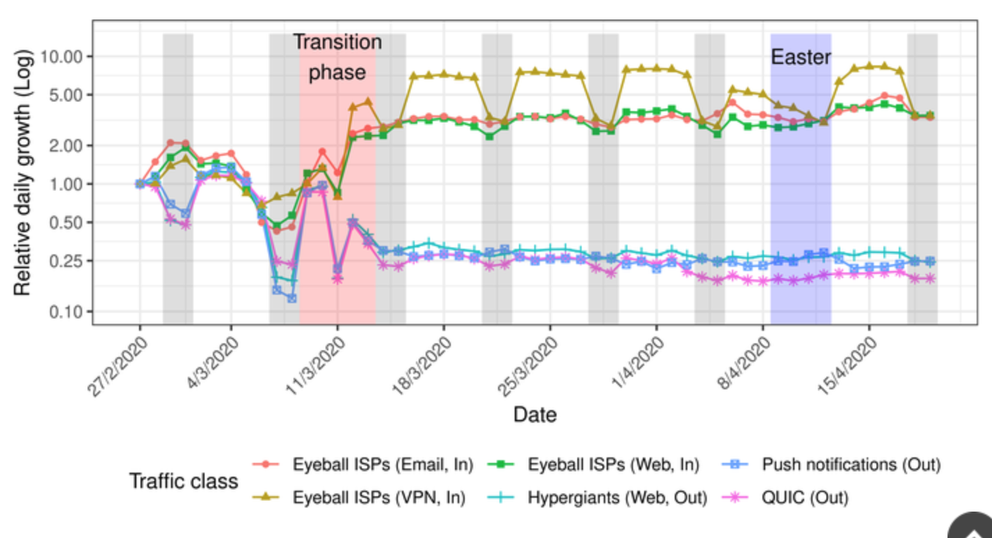
Figure 5: Relatively daily growth of connections for selected traffic categories in the educational network. Gray areas indicate weekends, the red area is the transition phase enforcing confinement measures, and the blue area indicates the Easter break.
Now let's look at the different classes of traffic in the educational network. In Figure 5 we see that the median number of daily incoming web connections increases by over 77% and the number of outgoing connections decreases by more than 50%. This reduction is even greater for outgoing web traffic towards hypergiants or QUIC. These drops also correlate with the decrease in outgoing connections to Android and iOS mobile services (65% decrease on average), as well as towards streaming services like Spotify (83% decrease). Simultaneously, services supporting remote working and lecturing surge: We observe increments in web (1.7x), email (1.8x), VPN (4.8x), Remote Desktop (5.9x), and SSH (9.1x) connections.
To conclude, our analysis of the educational network shows that changes in Internet traffic due to the COVID-19 pandemic are affecting different networks in various ways. Yet all networks observe some form of change, be it in a reduction in traffic, an increase in traffic, a change in working days and weekend days patterns, or a change in traffic classes. To better understand these changes and identify the ones which are here to stay, we will continue our measurements in search of the new normal.
Find more analyses in the paper
As this article only scratches the surface of the changes that we have seen in Internet traffic due to the pandemic, we want to invite the interested reader to check out our IMC 2020 paper:
- "The Lockdown Effect: Implications of the COVID-19 Pandemic on Internet Traffic"
The preprint of the paper is available here on arXiv.
In the paper you can find answers to the following interesting questions:
- How does the growth for hypergiant ASes differ compared to other ASes?
- How much did QUIC traffic increase during the lockdown?
- How does gaming traffic change at the Southern European IXP?
- Is VPN traffic increasing as employees are accessing company servers from home?
- And many more…
Comments 0
The comments section is closed for articles published more than a year ago. If you'd like to inform us of any issues, please contact us.