In this article we present a prototype web portal, which demonstrates the deployment of RIPE Atlas probes within eyeball networks based on Internet user population estimates per Autonomous System Number (ASN) per country.
The main motivation for this work was an earlier RIPE Labs article entitled Improving RIPE Atlas Coverage - Which Networks Are Missing? We wanted to get an up to date view of RIPE Atlas coverage in networks with many end-users ("eyeball networks"), and so we created a daily reporting portal that shows this coverage.
The portal prototype is available here: http://sg-pub.ripe.net/petros/population_coverage/
Eyeball Networks
Eyeball networks are networks with large user populations. Our sister-RIR APNIC provides end-user market share estimates per ASN for the largest eyeball networks in a given country here. As this is based on measurements using Google Advertisements, it is likely to contain a bias that reflects that. Based on communications with APNIC staff, we believe this data has an error range of a few percentage points.
On a daily basis, we fetch the data for 249 countries and apply certain thresholds in order to consider a network as an eyeball network. Per country we use the inferred ISP market shares to estimate which networks (ASes) are the dominant players up to a cumulative fraction of 95% of the Internet users in that country. In our portal, we don't consider an ISP a major eyeball network if it has less then 0.1% of market share. Sometimes this last restriction causes us to report on less then 95% of the market.
An interesting outlier is Russia, where the eyeball ecosystem looks highly diverse and fragmented. In this case, many of the networks we would need in order to cover 95% of the market fall below our 0.1% market share threshold. For anything under this threshold, one would need 343 ASNs to cover the 95% of market share.
Browse Data
On the portal, you can explore the data by choosing between two formats: the tabular form or the world map visualisation. Furthermore, the user can move back in time, but can also sort the table or search for a specific country.
Table
In the table view (Figure 1) you can find all countries (by ISO 3166 two-letter country code) and estimates of how much end-user market networks are covered by RIPE Atlas probes. We show this for IPv4 and IPv6, but also for probes marked 'public' or 'private'. This last one is interesting because we think public probes add most value to the RIPE Atlas network.
Clicking on a specific country allows you to get a more detailed view of that country (see Figure 2). This detailed view will show the networks with the largest estimated market share, together with the number of probes that are deployed in the network. Rows are coloured green if three or more IPv4 capable public probes are in that network; i.e. if we have some redundancy in sources from that particular network. If we have one or two probes, the row is coloured yellow. Rows without colour represent networks where it would potentially be interesting to deploy new RIPE Atlas probes. This is particularly interesting for RIPE NCC staff distributing RIPE Atlas probes, and also for RIPE Atlas ambassadors to see where to focus attention for probe distribution.

Figure 1: Table overview of "eyeball coverage" sorted by Internet users
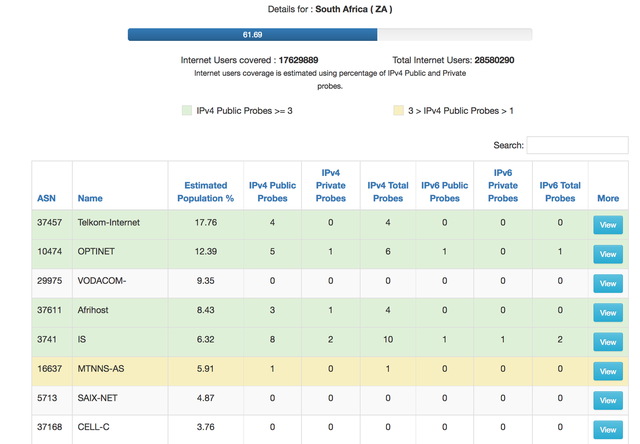

Figure 2: Overview of eyeball coverage for a specific country. In this case South Africa
World Map
On the world map visualisation, we offer four different visualisations based on the IP version of the probes (IPv4/IPv6), and their type (only public, private and public). Here we consider an eyeball network to be covered if there is at least one active RIPE Atlas probe deployed in that network.
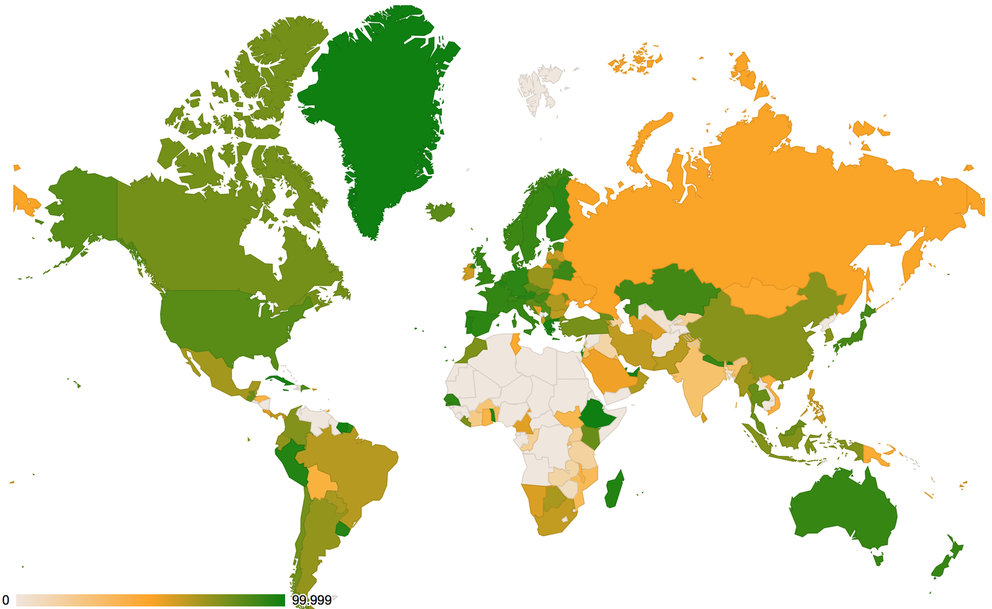
Below you can see an example world map showing the coverage using IPv4 public and private RIPE Atlas probes:

On that map we can see that the RIPE Atlas coverage on eyeball networks in Africa is none or very low. RIPE Atlas ambassadors in the Africa region can use the portal to identify the missing networks and target them to deploy new probes and increase the diversity and coverage of the RIPE Atlas network. As an example, in Nigeria we only cover an estimated 1.3% of the end-user market. You can get a detailed list of missing networks using the tabular form.
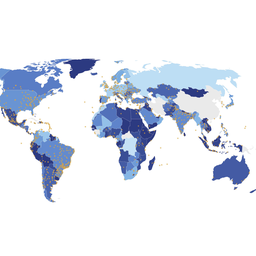
The next figure depicts a world map showing coverage using IPv6 public and private RIPE Atlas probes:

You can see that the IPv6 coverage of eyeball networks is significantly lower in comparison with IPv4 support. Interestingly, Uruguay, Finland and Belgium seem to perform very well, with more than 90% IPv6 coverage of their eyeball networks.
Conclusions
Considering these estimates, RIPE Atlas seems to be well deployed in end-user networks, with some of the more notable exceptions in Africa. We would like to invite RIPE Atlas ambassadors and other people interested in distributing and hosting RIPE Atlas probes to look at this data and focus their efforts on the networks with little or no coverage as can been seen here.
Data Sources
- RIPE Atlas probe data. The data are fetched from the RIPE Atlas platform using RIPE Atlas Cousteau API.
- Internet Users* per country data. The source of these data is the Internet Live Stats. Internet Live Stats uses data from the International Telecommunication Union (ITU), United Nations Population Division, Internet & Mobile Association of India (IAMAI), World Bank. (*Internet User = individual, of any age, who can access the Internet at home, via any device type and connection). More details and definitions can be found here.
- User population per ASN data. The source of this data is the APNIC estimates of user populations per ASN.


Comments 0
The comments section is closed for articles published more than a year ago. If you'd like to inform us of any issues, please contact us.