
As a result of the cooperation between the RIPE NCC and Measurement Lab (M-Lab), you can now visualise the bandwidth profiles and network activity of IP prefixes and individual countries. This is provided as RIPEstat widgets using data collected by the M-Lab platform. See below for details about the measurement methodology and relevant use cases.
Introduction
We created two new RIPEstat widgets that enable you to visualise the activity of Internet hosts within a certain network or geographical area.
This was made possible using data provided by the
Measurement Lab
(M-Lab) platform, which collects data concerning the connection of hosts to the global Internet.
The Observed Network Activity widget identifies where host activity within a certain network has been observed. The Observed Bandwidth Capacity widget shows the distribution of hosts within a network according to the bandwidth of their Internet connection.
| Observed Network Activity | Observed Bandwidth Capacity |
|---|
Observed Network Activity widget (left) next to the Observed Bandwidth Capacity widget (right)
Measurement Lab
M-Lab is a global platform dedicated to truly open network measurement.
What does “truly open” mean? It means that M-Lab provides an infrastructure running open source tools that end users can run to measure the performance of their Internet connections. All of the measurement results are made publicly available under CC0 licence , for free, to anyone who wants to verify them, conduct primary research as well as build on existing research, or, say, build a RIPEstat widget.
By keeping the infrastructure, the measurement methodology and data open, M-Lab allows in-depth, independent peer review, which ensures that any claims made based on the M-Lab data can be verified and validated, that the measurement tools can be improved and that bugs can be spotted and fixed.
For more information about M-Lab, see
http://measurementlab.net/
.
Methodology
Every time an Internet user runs an M-Lab test, the test results are collected on M-Lab servers. All the data collected on M-Lab servers are published once per day, both in raw format and via an SQL-like API. M-Lab’s data repository currently contains nearly 800TB of measurement data and it keeps growing.
For more information about the M-Lab data sets and how to access them, see http://measurementlab.net/data .
The new RIPEstat widgets use the data collected by NDT (Network Diagnostic Tool), one of the M-Lab tests, which provides sophisticated diagnostic information about end-user Internet connections along with basic information, such as connection throughput. NDT is both available as a stand-alone application as well as integrated into a number of third-party clients , such as a popular BitTorrent client .
For more information about NDT, see http://measurementlab.net/measurement-lab-tools#ndt . In particular, for more information about how the throughput is computed, see https://code.google.com/p/m-lab/wiki/PDEChartsNDT .
RIPEstat widgets
You can find the new RIPEstat Observed Bandwidth Capacity and Observed Network Activity widgets in the Activity tab on the RIPEstat results page.
Both widgets can be queried by IPv4 prefix or geographical area (country).
When querying for prefixes, all of the hosts with an IP address within that address range are included in the result.
For country queries, all of the hosts geographically tagged by M-Lab (using
Maxmind
geolocation data) within that country are used.
The results displayed by default show the data for the time period over the last seven days.
You can query for a different time period by using the query time control at the bottom of the widgets (see Figure 2 below).

Figure 2: Control panel that allows you to change the time period.
Observed Bandwidth Capacity
widget
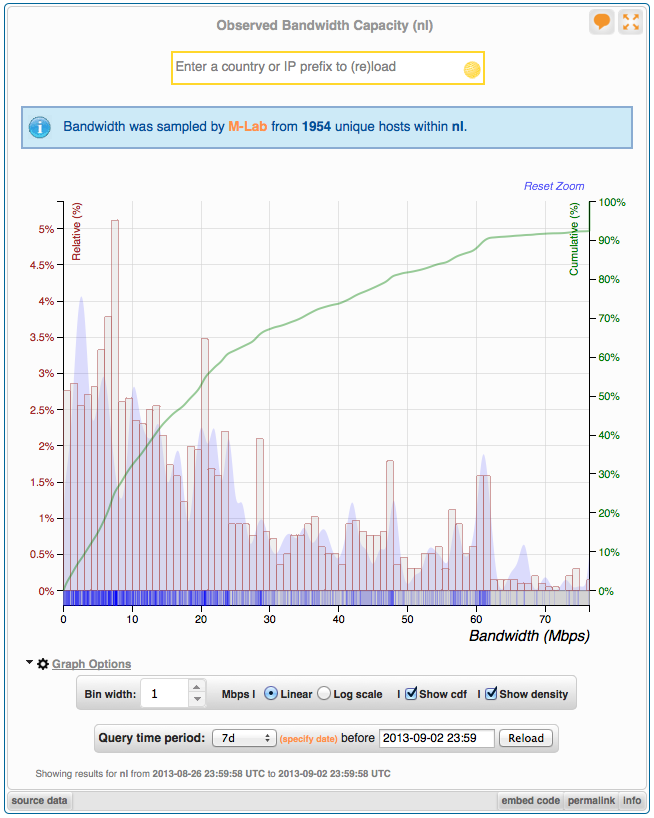
The Observed Bandwidth Capacity widget can be useful to profile and analyse the bandwidth capacity of a certain network or geographical region, by visualising the distribution of Internet hosts across the bandwidth spectrum.
The visualisation is provided as a set of interactive statistical distribution tools. This allows you to identify not only the average bandwidth for all the hosts combined, but also to perform an analysis on the typical bandwidth hotspots that characterise a certain resource.

A histogram shows the individual values aggregated into bins (default 1
Mbps
width), highlighting the most common ranges of bandwidth.
To unclutter the initial rendering from occasional very-high bandwidth outliers, the graph starts focused in the 98th percentile range. Using click-and-drag interactions on the graph, it's possible to zoom in on a particular bandwidth section (see the image on the right). Reset Zoom shows the whole bandwidth range for that resource.
Additional controls to statistically manipulate the graph can be found by expanding the Graph Options section. Using these controls you can:
- Change the Mbps bin width of the histogram
- Represent the bandwidth spectrum on a (base 2) logarithmic scale (generates bins with increasing width)
- Overlay a cumulative (cdf) and/or density function on the graph

Observed Network Activity widget

The
Observed Network Activity widget
widget can be useful to identify areas where a higher density of active Internet hosts has been observed.
It represents all the hosts for which at least one measurement was observed by the M-Lab servers during the specified time period.
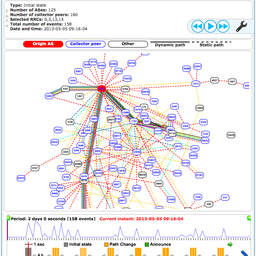
The results are shown distributed geographically (see the image above) as well as organised on a two dimensional IP address map (see the image below).

To facilitate the visualisation, hosts on the address space map (shown on the left) are clustered into subnets and coloured according to the number of hosts within that segment.
This allows you to immediately identify the areas of the address space where the host density is higher.
Clicking on one of the segments re-renders the visualisation for that specific subnet.
The CIDR size of the subnet clusters can be changed using the subnet size control below the chart.
It's important to note that if no measurements were observed from a host, it does not necessarily mean that it was not active during the time period. Because not all existing hosts are measured, the results are presented as positives only, and no inference can be made on the hosts that are not included.
Use Cases
Clicking on the images below will open the particular scenario using a RIPEstat widget.
1) Profiling the typical bandwidth available within a country
- These tend to outline usage peaks near the capacities of common connectivity technologies, as is the case here for just under 30 Mbps.

2) Visualise the distribution of active hosts on an allocated address space block - This case shows the last RIPE NCC IPv4 /8 block that's currently being allocated progressively to LIRs. The allocated portion is revealed by the active hosts.

3) View which address blocks are most commonly used actively within a country - By clustering the active hosts in /8 subnets (using the subnet cluster control), you can identify the /8 blocks with higher host density (coloured red). The example below depicts Japan.

4) Identify the most common bandwidth provided within a certain network
-
The example below outlines a clear peak just under 10 Mbps, used by more than 25% of the total active hosts.

5) Visualise the geographical spread of the active hosts in a network - Using the geographical section it is possible to see how localised the active hosts in a network are.

Privacy Policy
To protect the privacy of Internet users, M-Lab only runs active measurement experiments that are client-initiated and don’t collect any information about a user’s Internet activity.
M-Lab tools don’t monitor users online activities. Instead, they measure performance by sending a predetermined flow of data through the network. Each test, any time, from anywhere, sends this same synthetic stream of data from a client to an M-Lab server. What’s measured is the network’s reaction to this test traffic. It’s this, along with the IP address, that is included in the public M-Lab dataset.
All the results published in these RIPEstat widgets, including host details are covered by the
M-Lab acceptable use policy
.
Future Features
We intend to roll-out the following features for these two widgets in a future version:
- Support for Autonomous System (AS) queries
-
Enable in-widget comparison between prefixes and countries
- Enhanced query performance for reduced initial loading times
If you are interested in a specific feature, or would like to suggest other improvements, please let us know.
Contact
Do you have a suggestion, contribution, bug report or just general feedback regarding this new RIPEstat functionality? Please don't hesitate to contact us, either via the in-widget feedback or through any of these
channels
.
Also, if you are a data provider and would like to contribute or suggest additional data sets to enrich the current coverage, please get in touch.
Acknowledgements
Special thanks to Tiziana Refice and Meredith Whittaker from Measurement Lab for both their generous contributions to this article and general availability in solving issues related to the integration of M-Lab data in RIPEstat.
Comments 0
The comments section is closed for articles published more than a year ago. If you'd like to inform us of any issues, please contact us.