With IPv4 depletion imminent, we're keeping a close eye on allocation rates. In the article below you can see the IPv4 address allocations rates over time in all regions.
Some History
In January 2007, we published a report highlighting that the IPv4 allocation rate had increased significantly since early 2004. Before this change in trend, unallocated IPv4 was projected to be available until at least 2020 (see for example Geoff Huston's presentation from August 2003). By 2006 it was clear that continued growth would see IPv4 exhaustion occur sometime between 2010 and 2015.
In October 2010 we revisited this subject in the RIPE Labs article Interesting Graph - IPv4 Unassigned . We observed that the global IPv4 depletion rate between 2004-2010 had been remarkably stable at a rate of roughly 10 /8s per year. Growth had started to pick up in the course of 2009, however, leading to faster depletion than in the previous years.
IPv4 allocation rate now
Now, in January 2011, we are very close to IANA IPv4 exhaustion. APNIC's pool of available /8s shrunk to 1.4 /8s on 25 January 2011. With the high consumption rate in the Asia Pacific region, this means that APNIC can request an additional allocation of 2 /8s from IANA any time now. After this happens, the remaining five /8s will be distributed to the RIRs as stated in the global policy , which says that each RIR will get one /8 each.
This gives the Regional Internet Registries (RIRs) some breathing space, but not for long ...
So what happened? Where did the increased depletion rate come from? To answer this, we looked at the IPv4 allocation and assignment statistics the RIRs publish on a daily basis. Each file lists the number resources handed out by each RIR and the date the allocation or assignment has been made. These statistics have been published in a common format since 2004. Figure 1 below shows the evolution of total IPv4 address space in all regions starting in 2004.
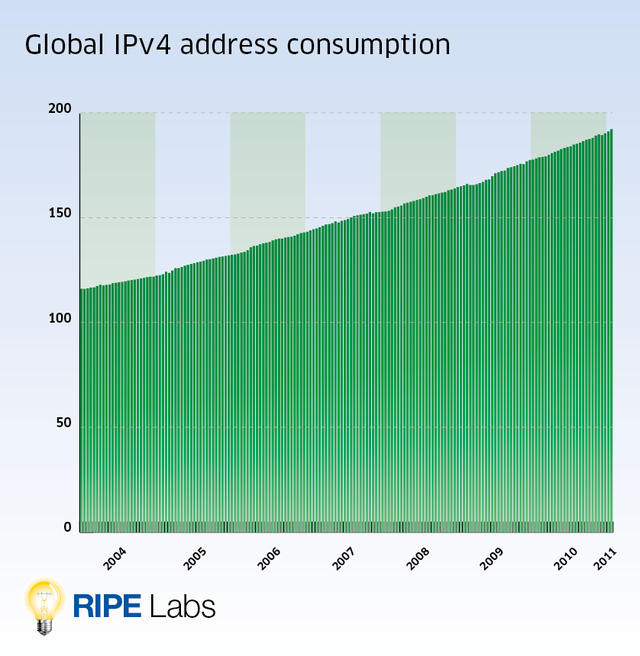
Figure 1: IPv4 addresses handed out by all RIRs since 2004
Next we looked at the rate of change. To smooth out the large fluctuations between daily or even weekly allocations, we calculate for each date the average amount of IPv4 addresses allocated in the preceding six months. Figure 2 shows this running average allocation rate in units of /8s per month, each colour representing one RIR. You can clearly see the increased demand of IPv4 addresses in the Asia Pacific region over the last few years.
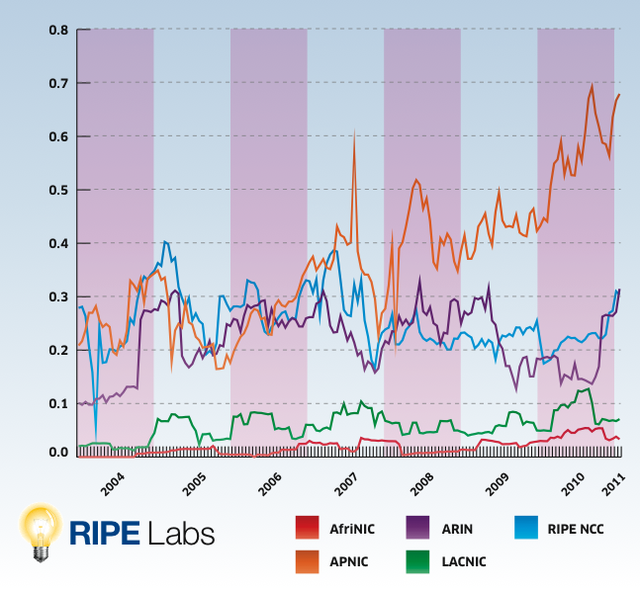
Figure 2: IPv4 addresses handed out since 2004 per RIR (6 month average)


Comments 3
The comments section is closed for articles published more than a year ago. If you'd like to inform us of any issues, please contact us.
Anonymous •
Can I know the % of IPv4 left?
Anonymous •
Marie,<br />Please see the FAQ on IPv4 exhaustion on the RIPE NCC web site: <a href="http://www.ripe.net/internet-coordination/ipv4-exhaustion/faq" rel="nofollow">http://www.ripe.net/[…]/faq</a><br />It doesn't give percentages, but it mentions how much unallocated IPv4 space the RIPE NCC currently has.
Anonymous •
<br /> Do you have a daily report regarding IPv4 addresses left ?<br />(Same for APNIC:<br /> <a href="http://www.apnic.net/community/ipv4-exhaustion/graphical-information" rel="nofollow">http://www.apnic.net/[…]/graphical-information</a><br /><br /> but it doesn't have to be graphical, just the number in /8, but updated<br /> daily)<br /><br />Thanks,<br />Yuval<br />